
The problem
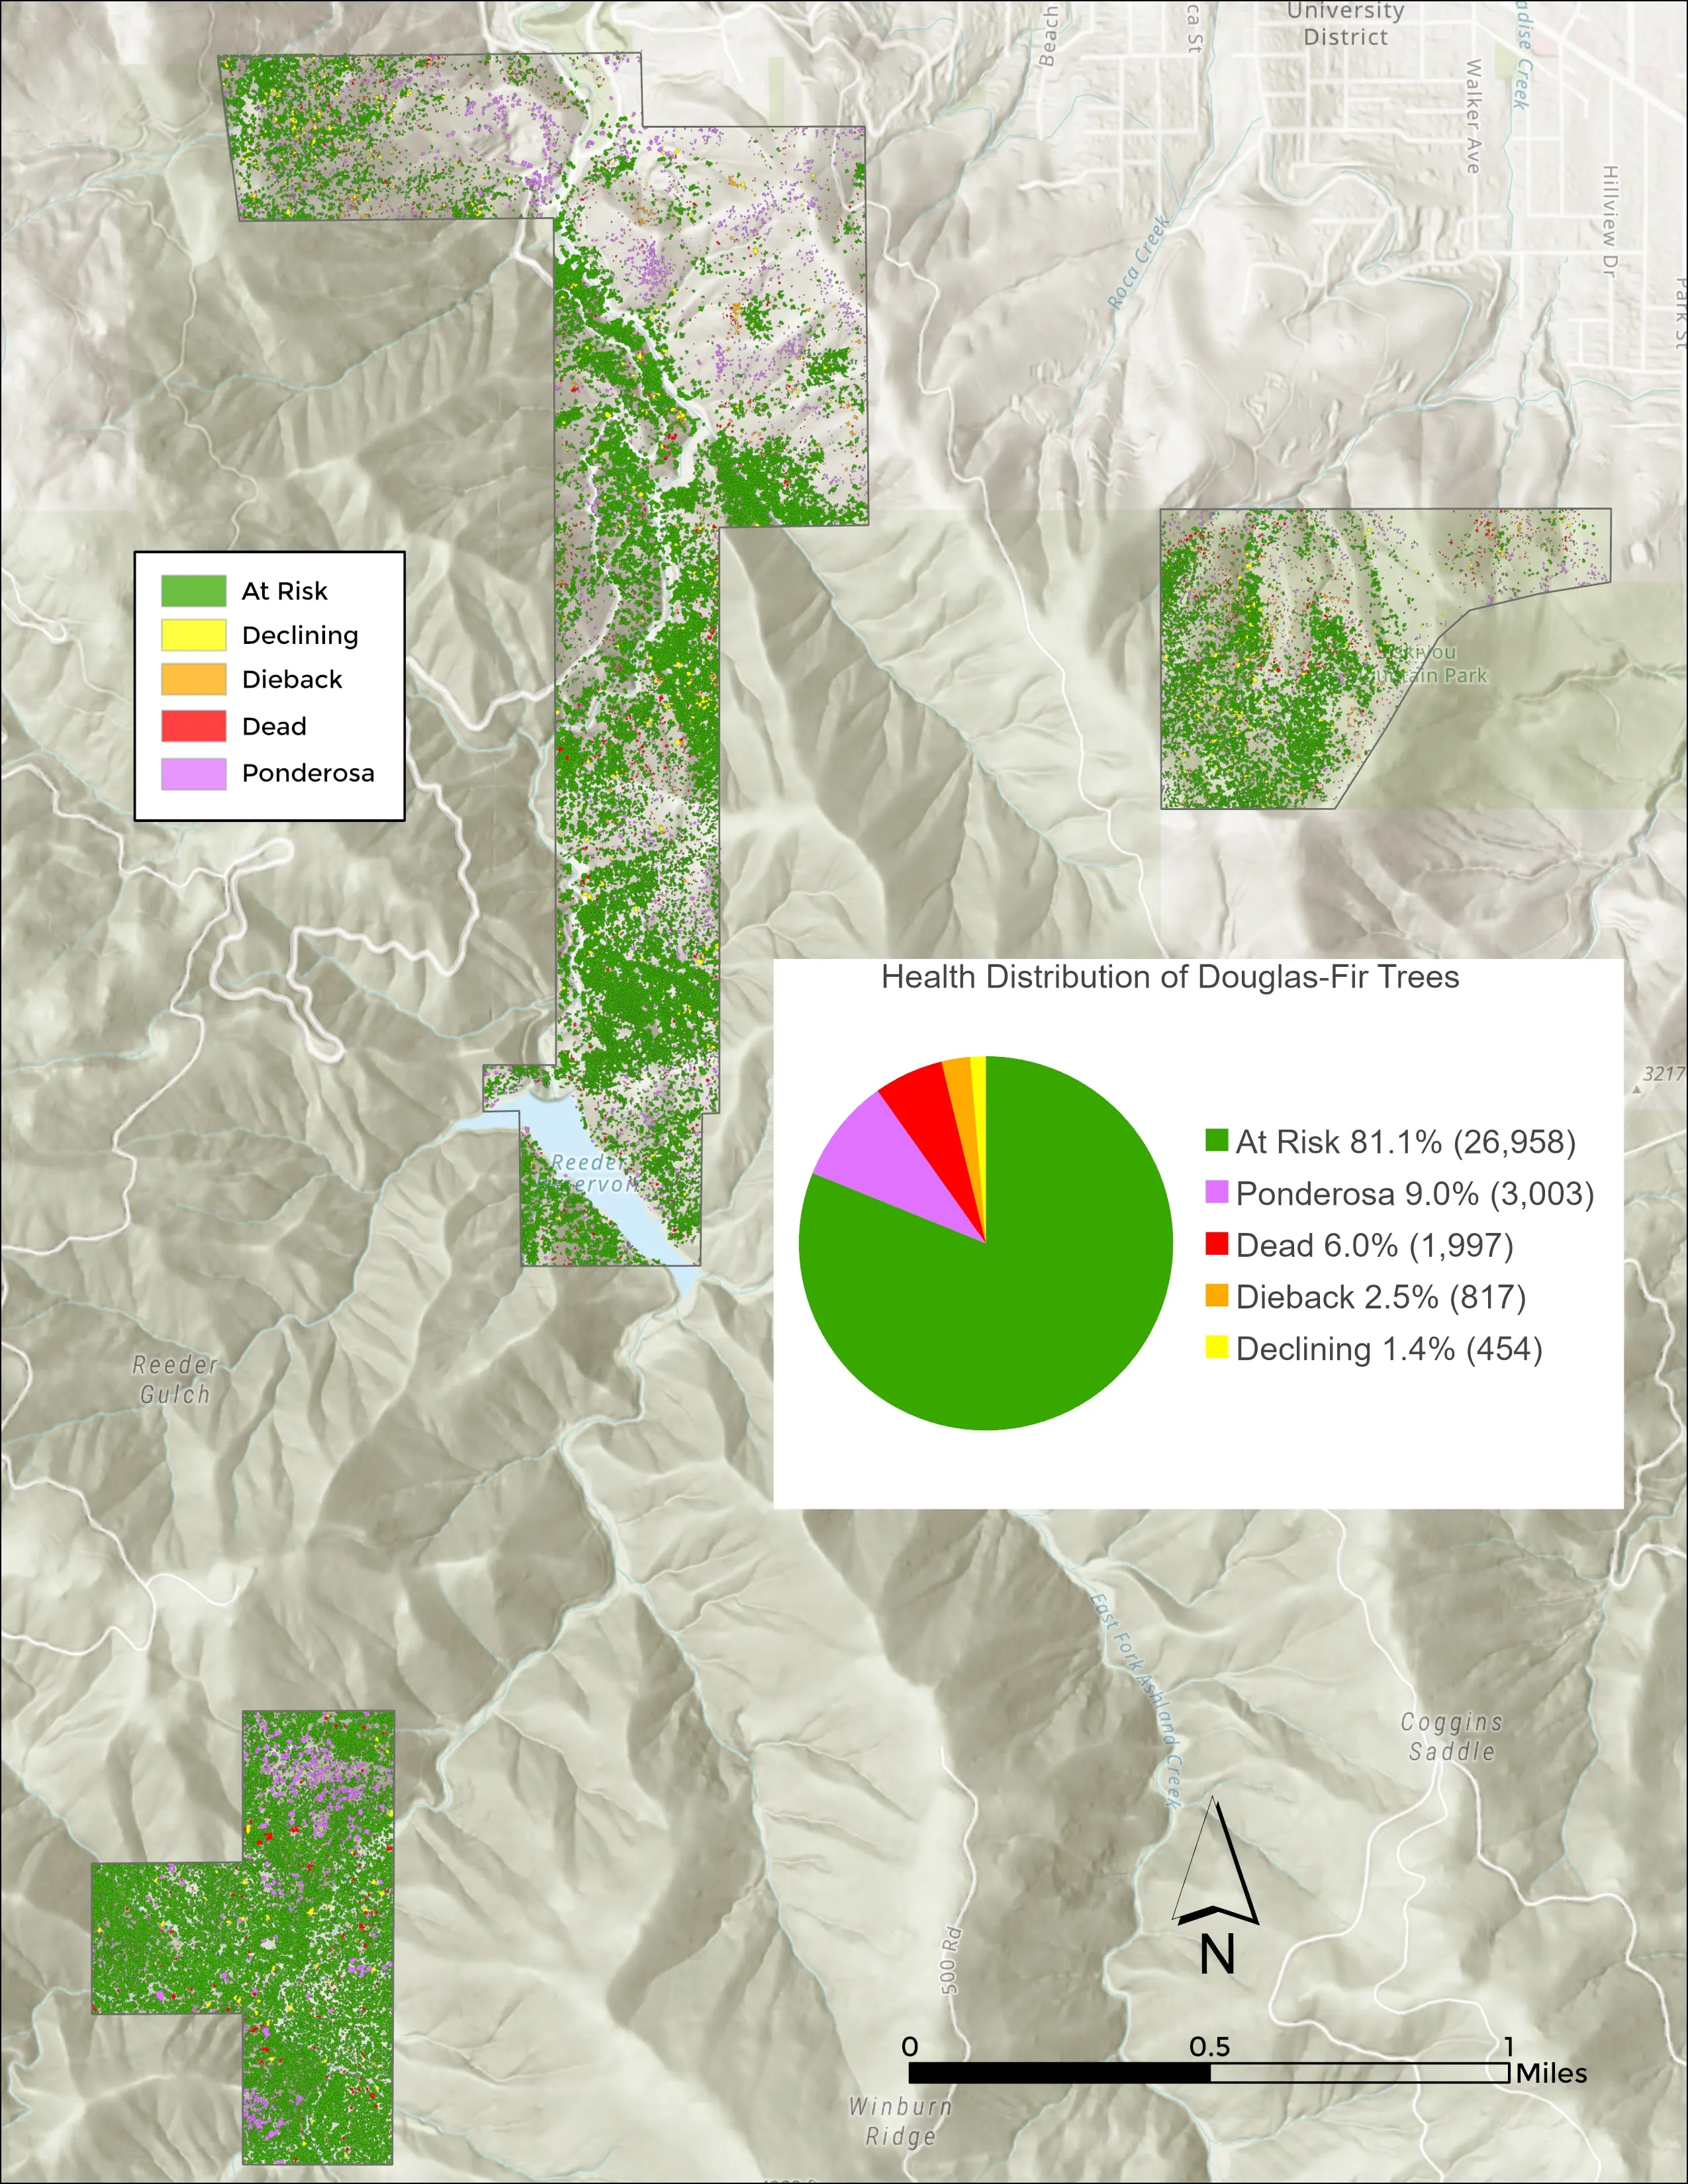
Douglas fir was dying across the Ashland watershed and the city needed a count. Which trees, where, how many, and how far along.
What we flew
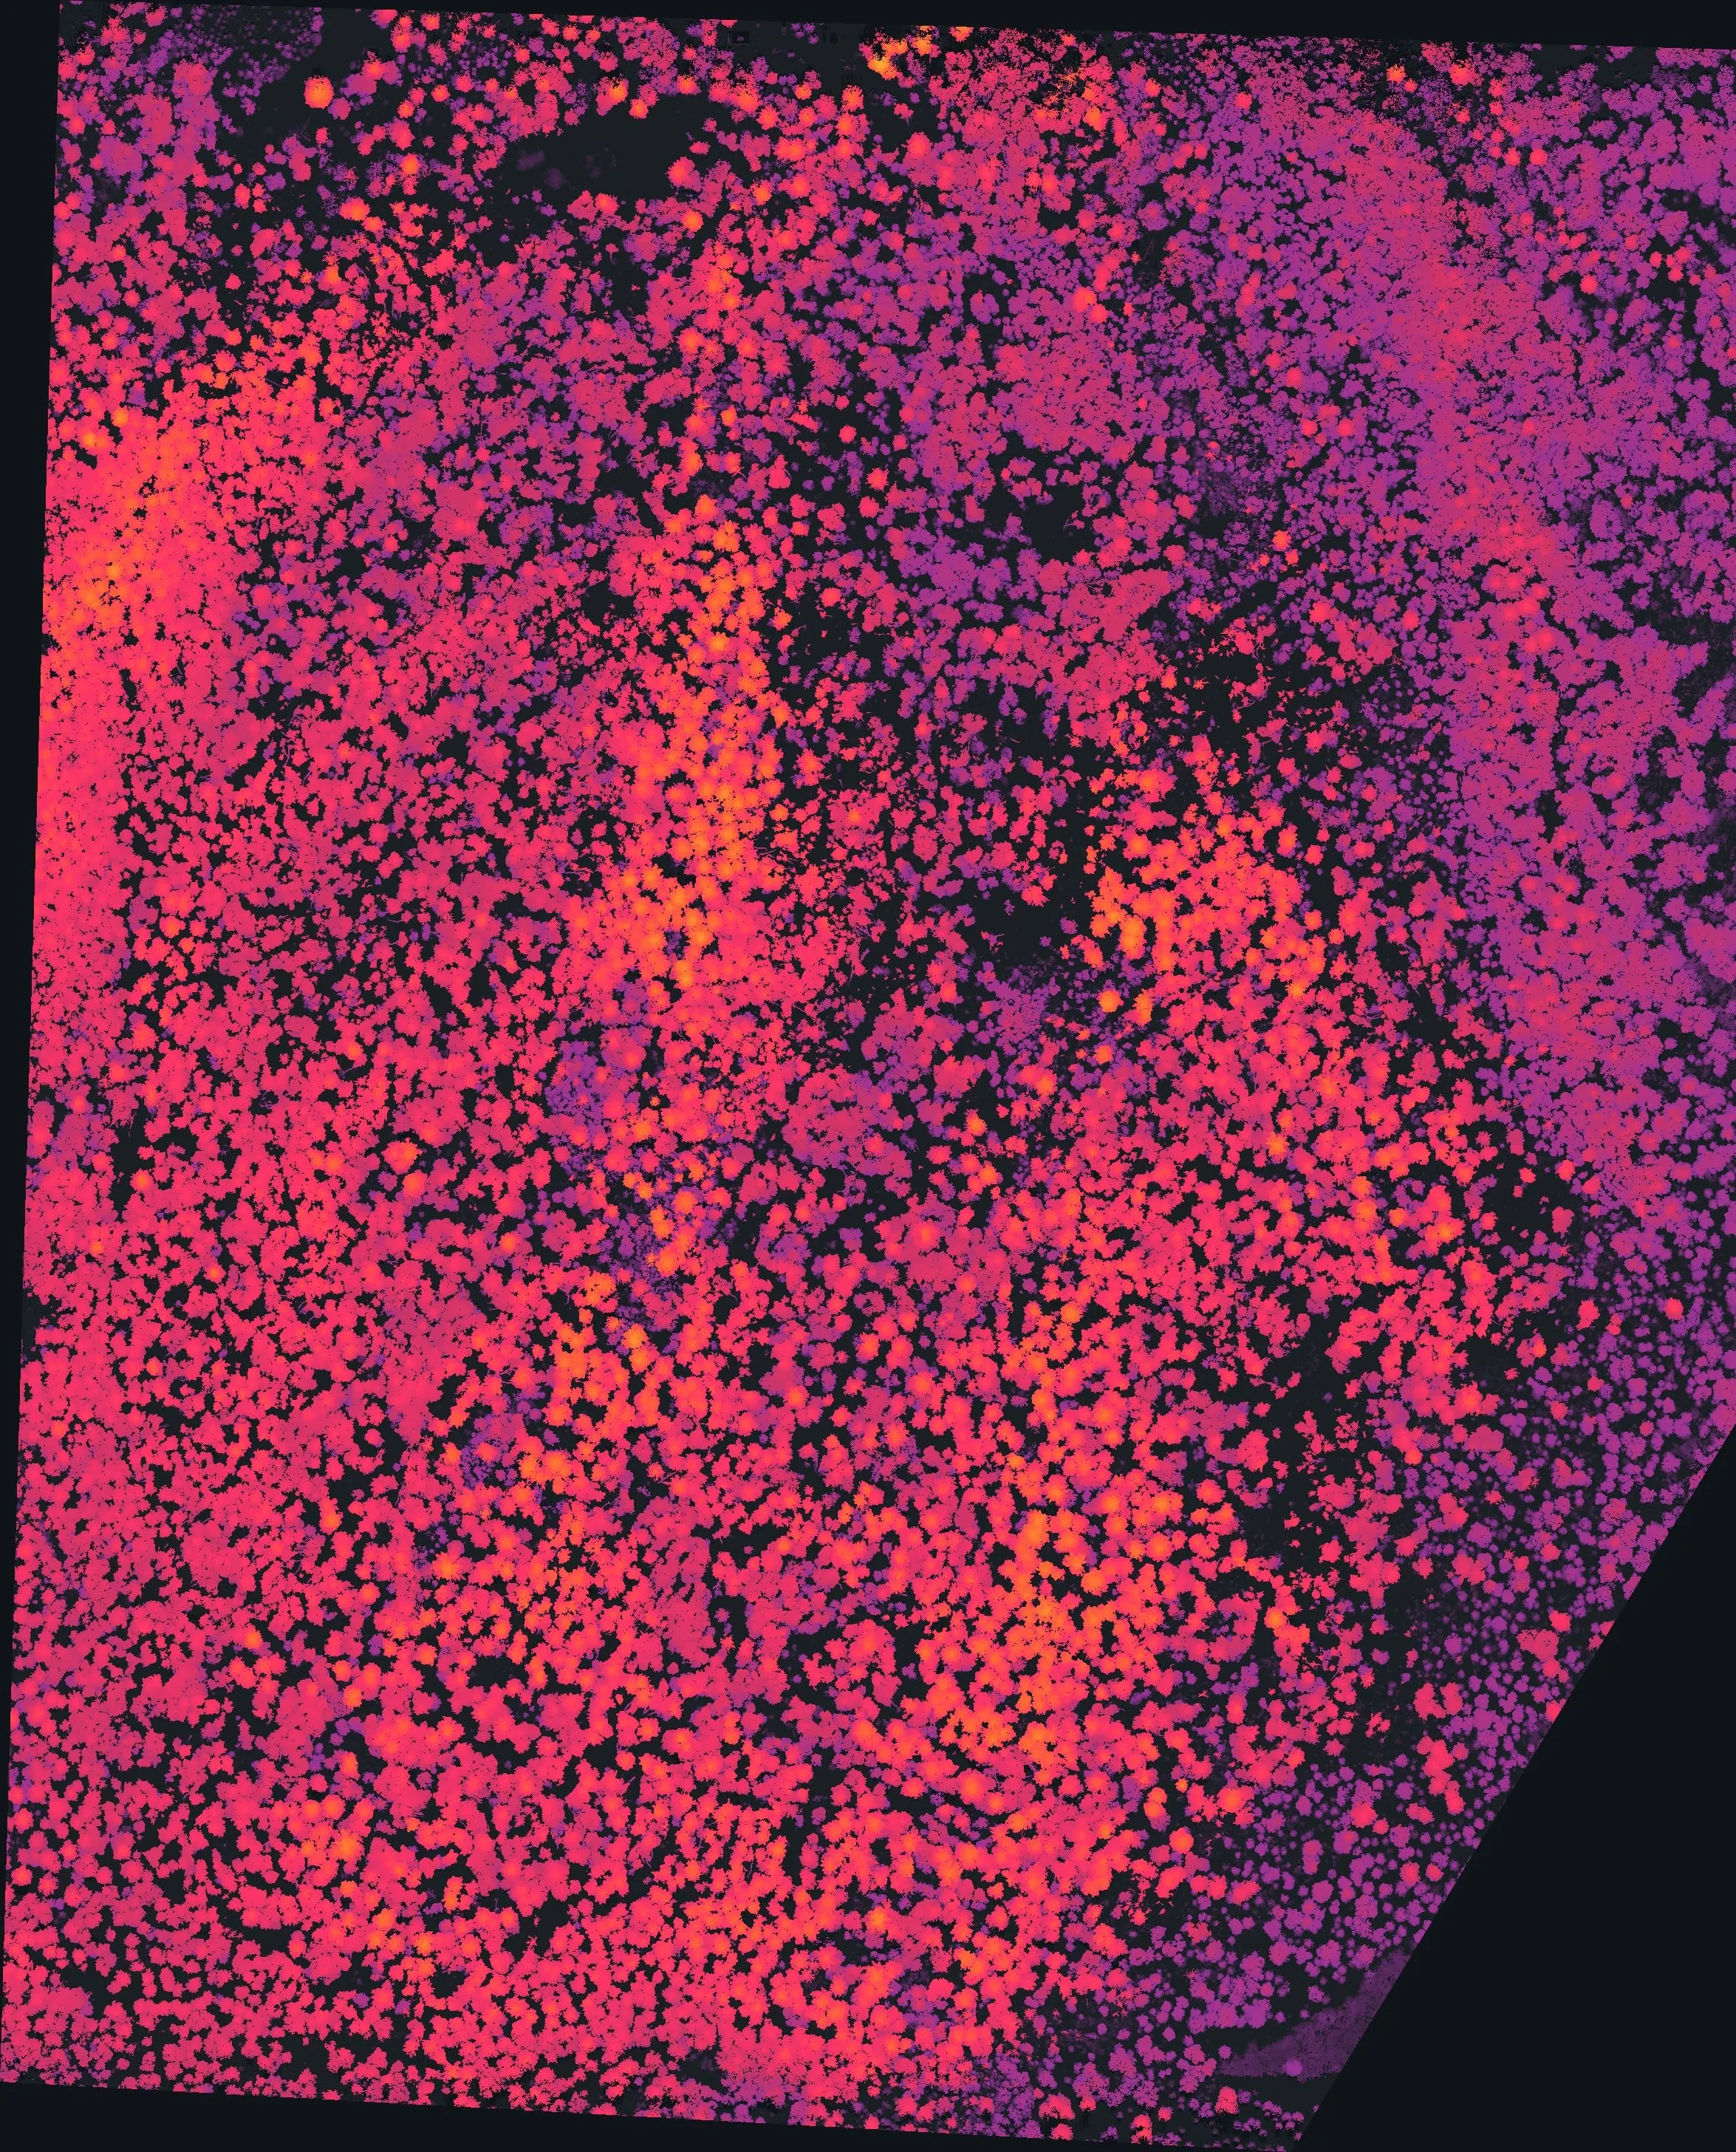
- Drone LiDAR for crown delineation and height
- MicaSense RedEdge MX multispectral for the health signal
- RGB for reference and review
What we delivered
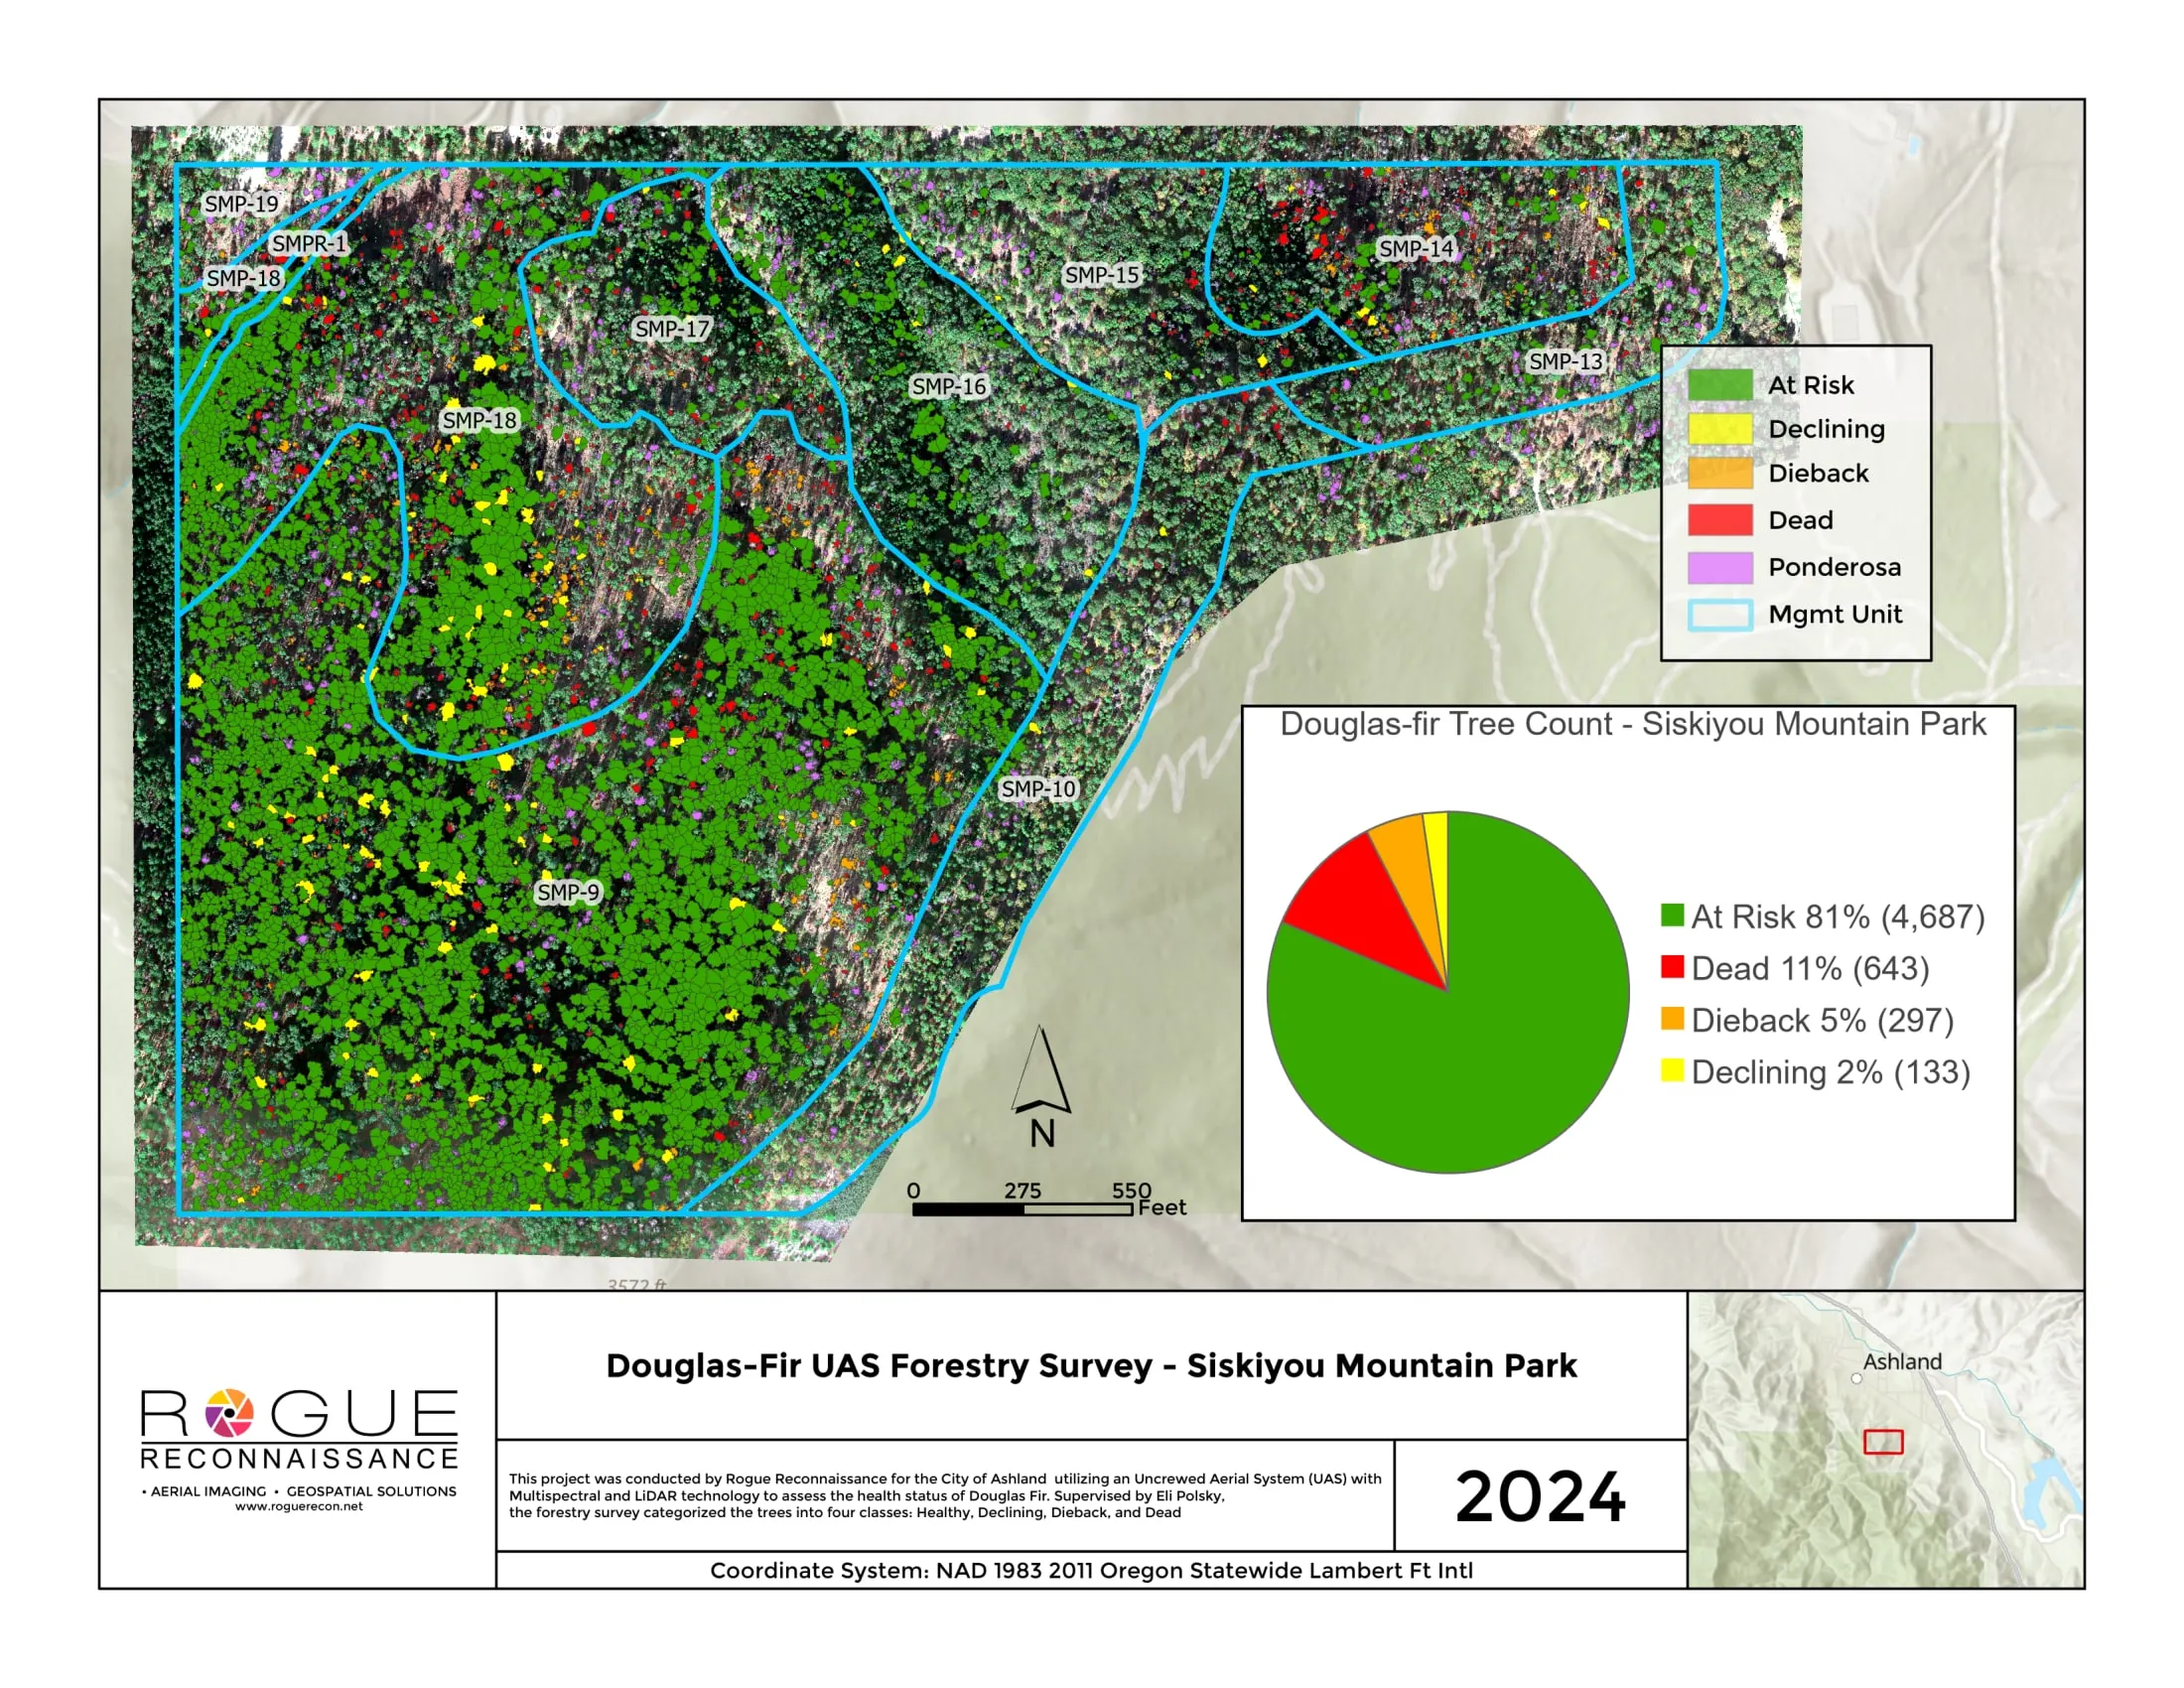
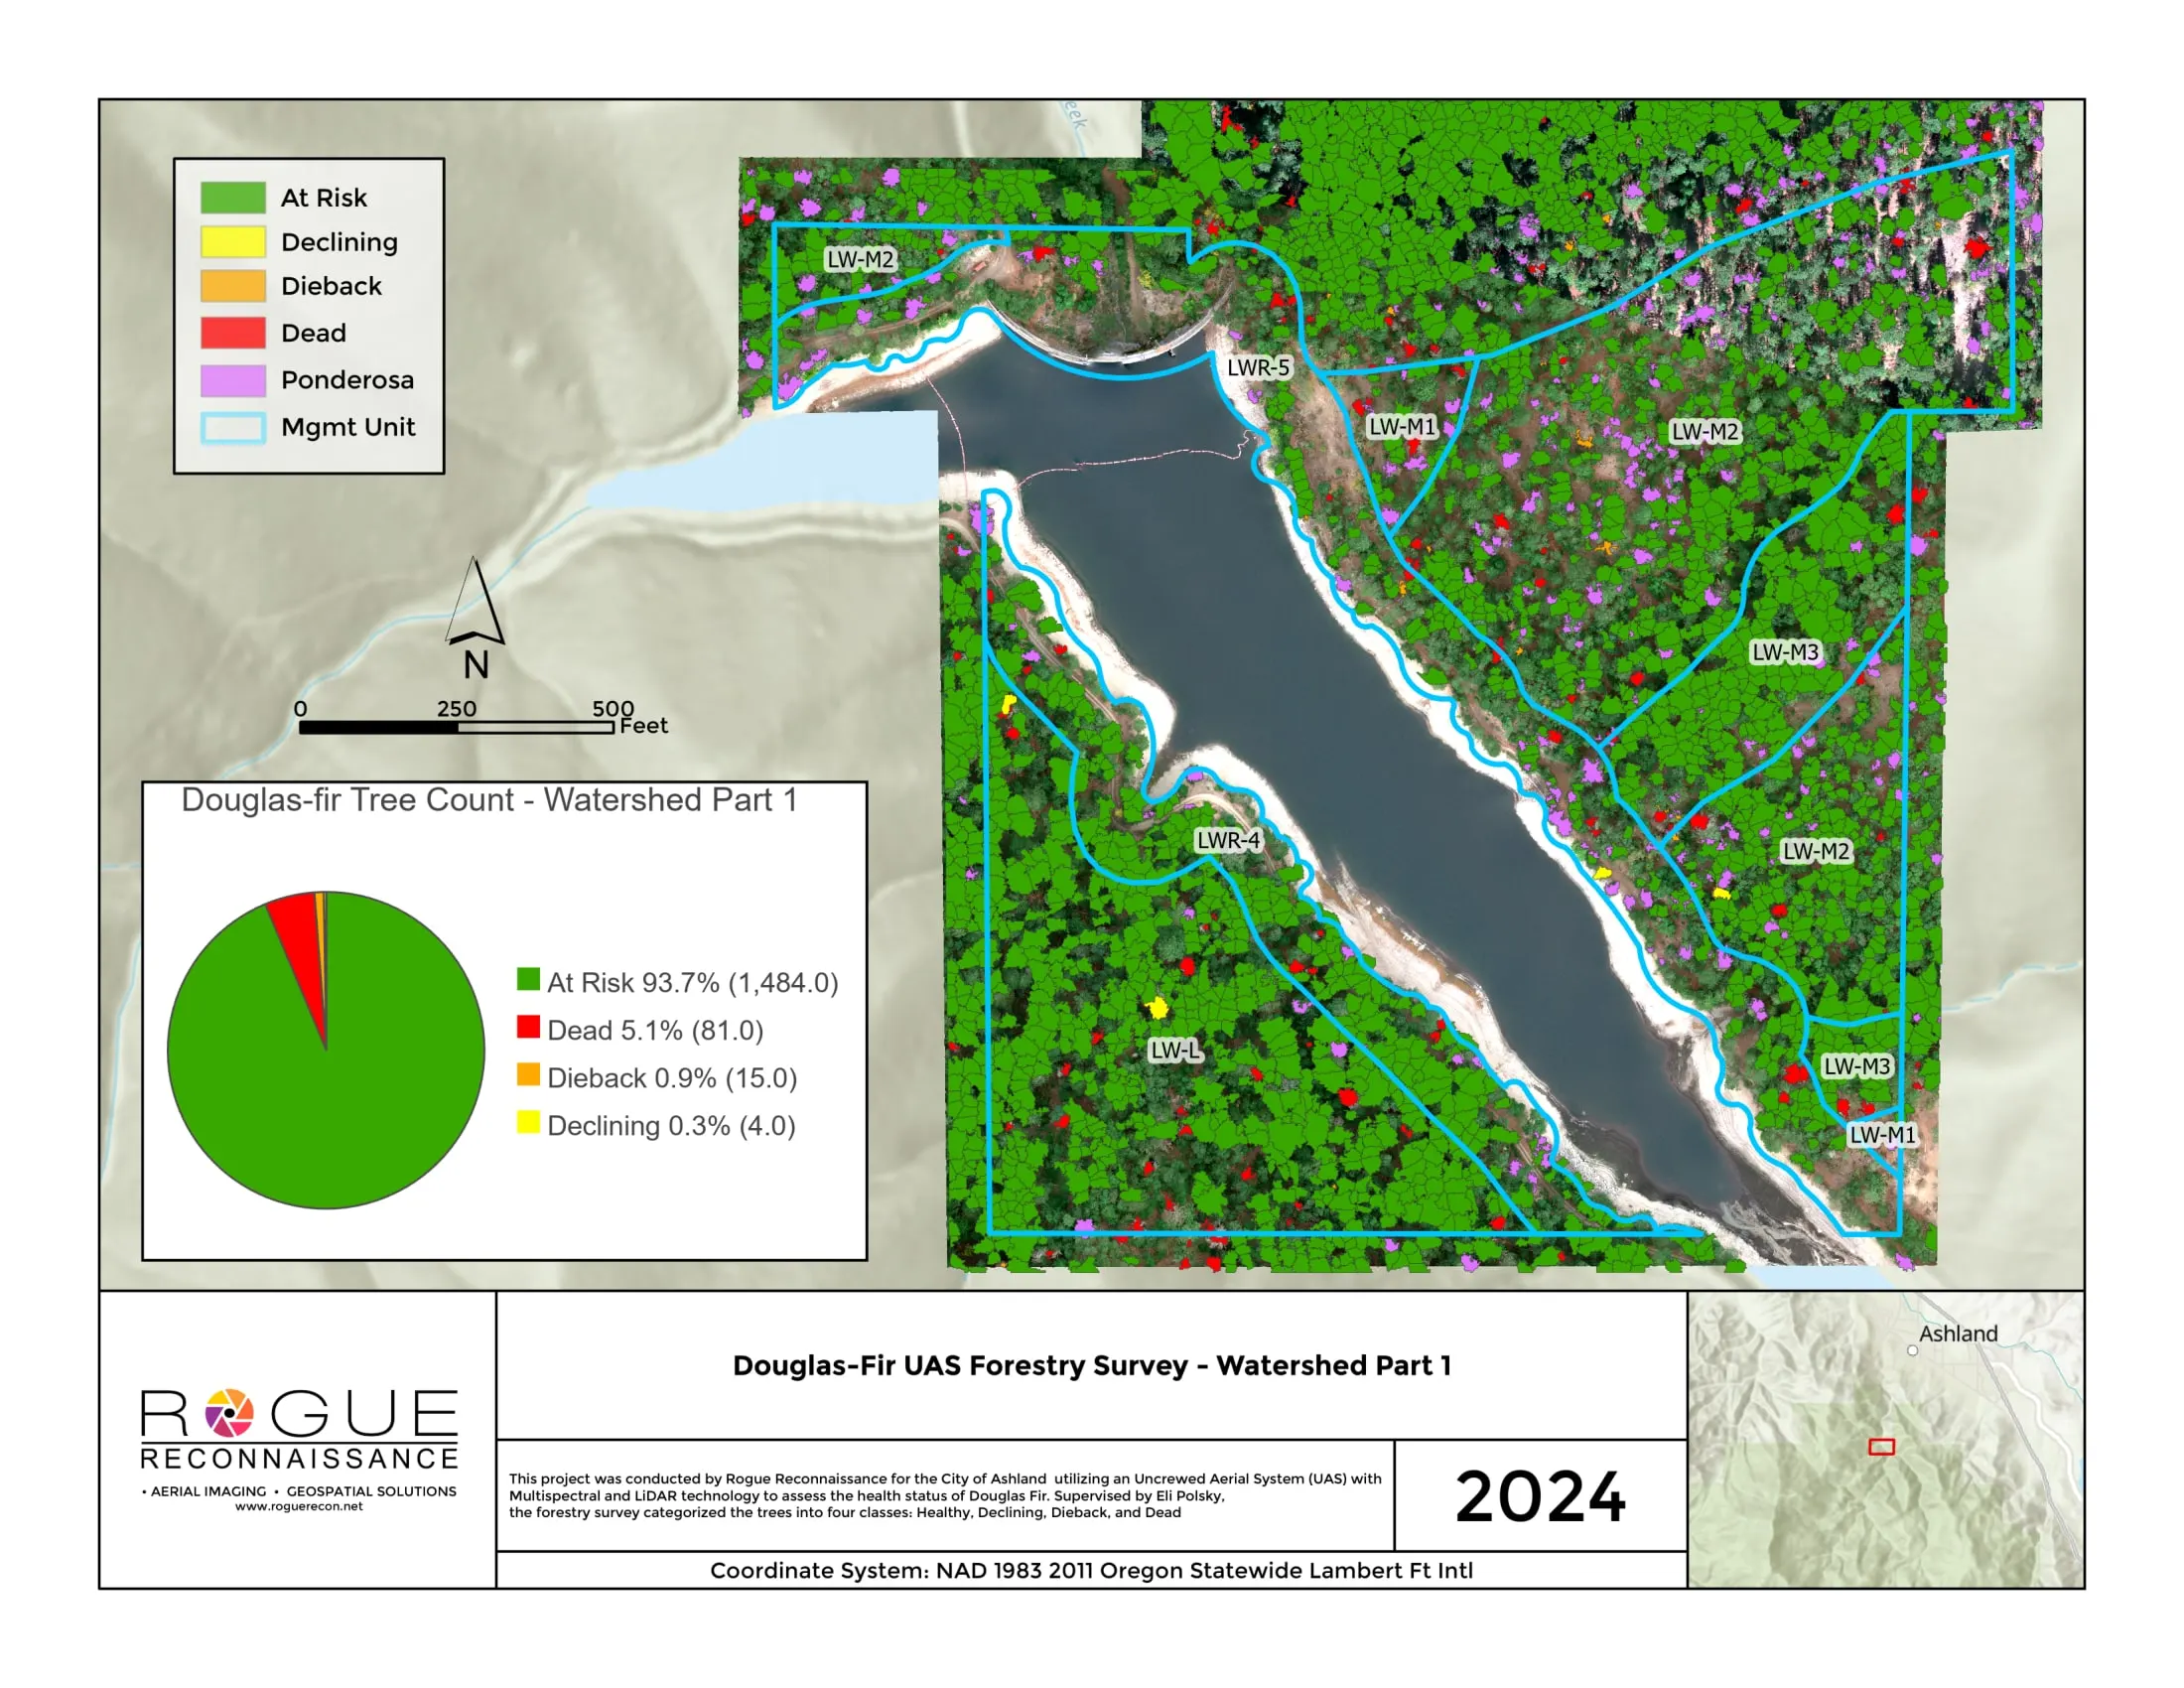
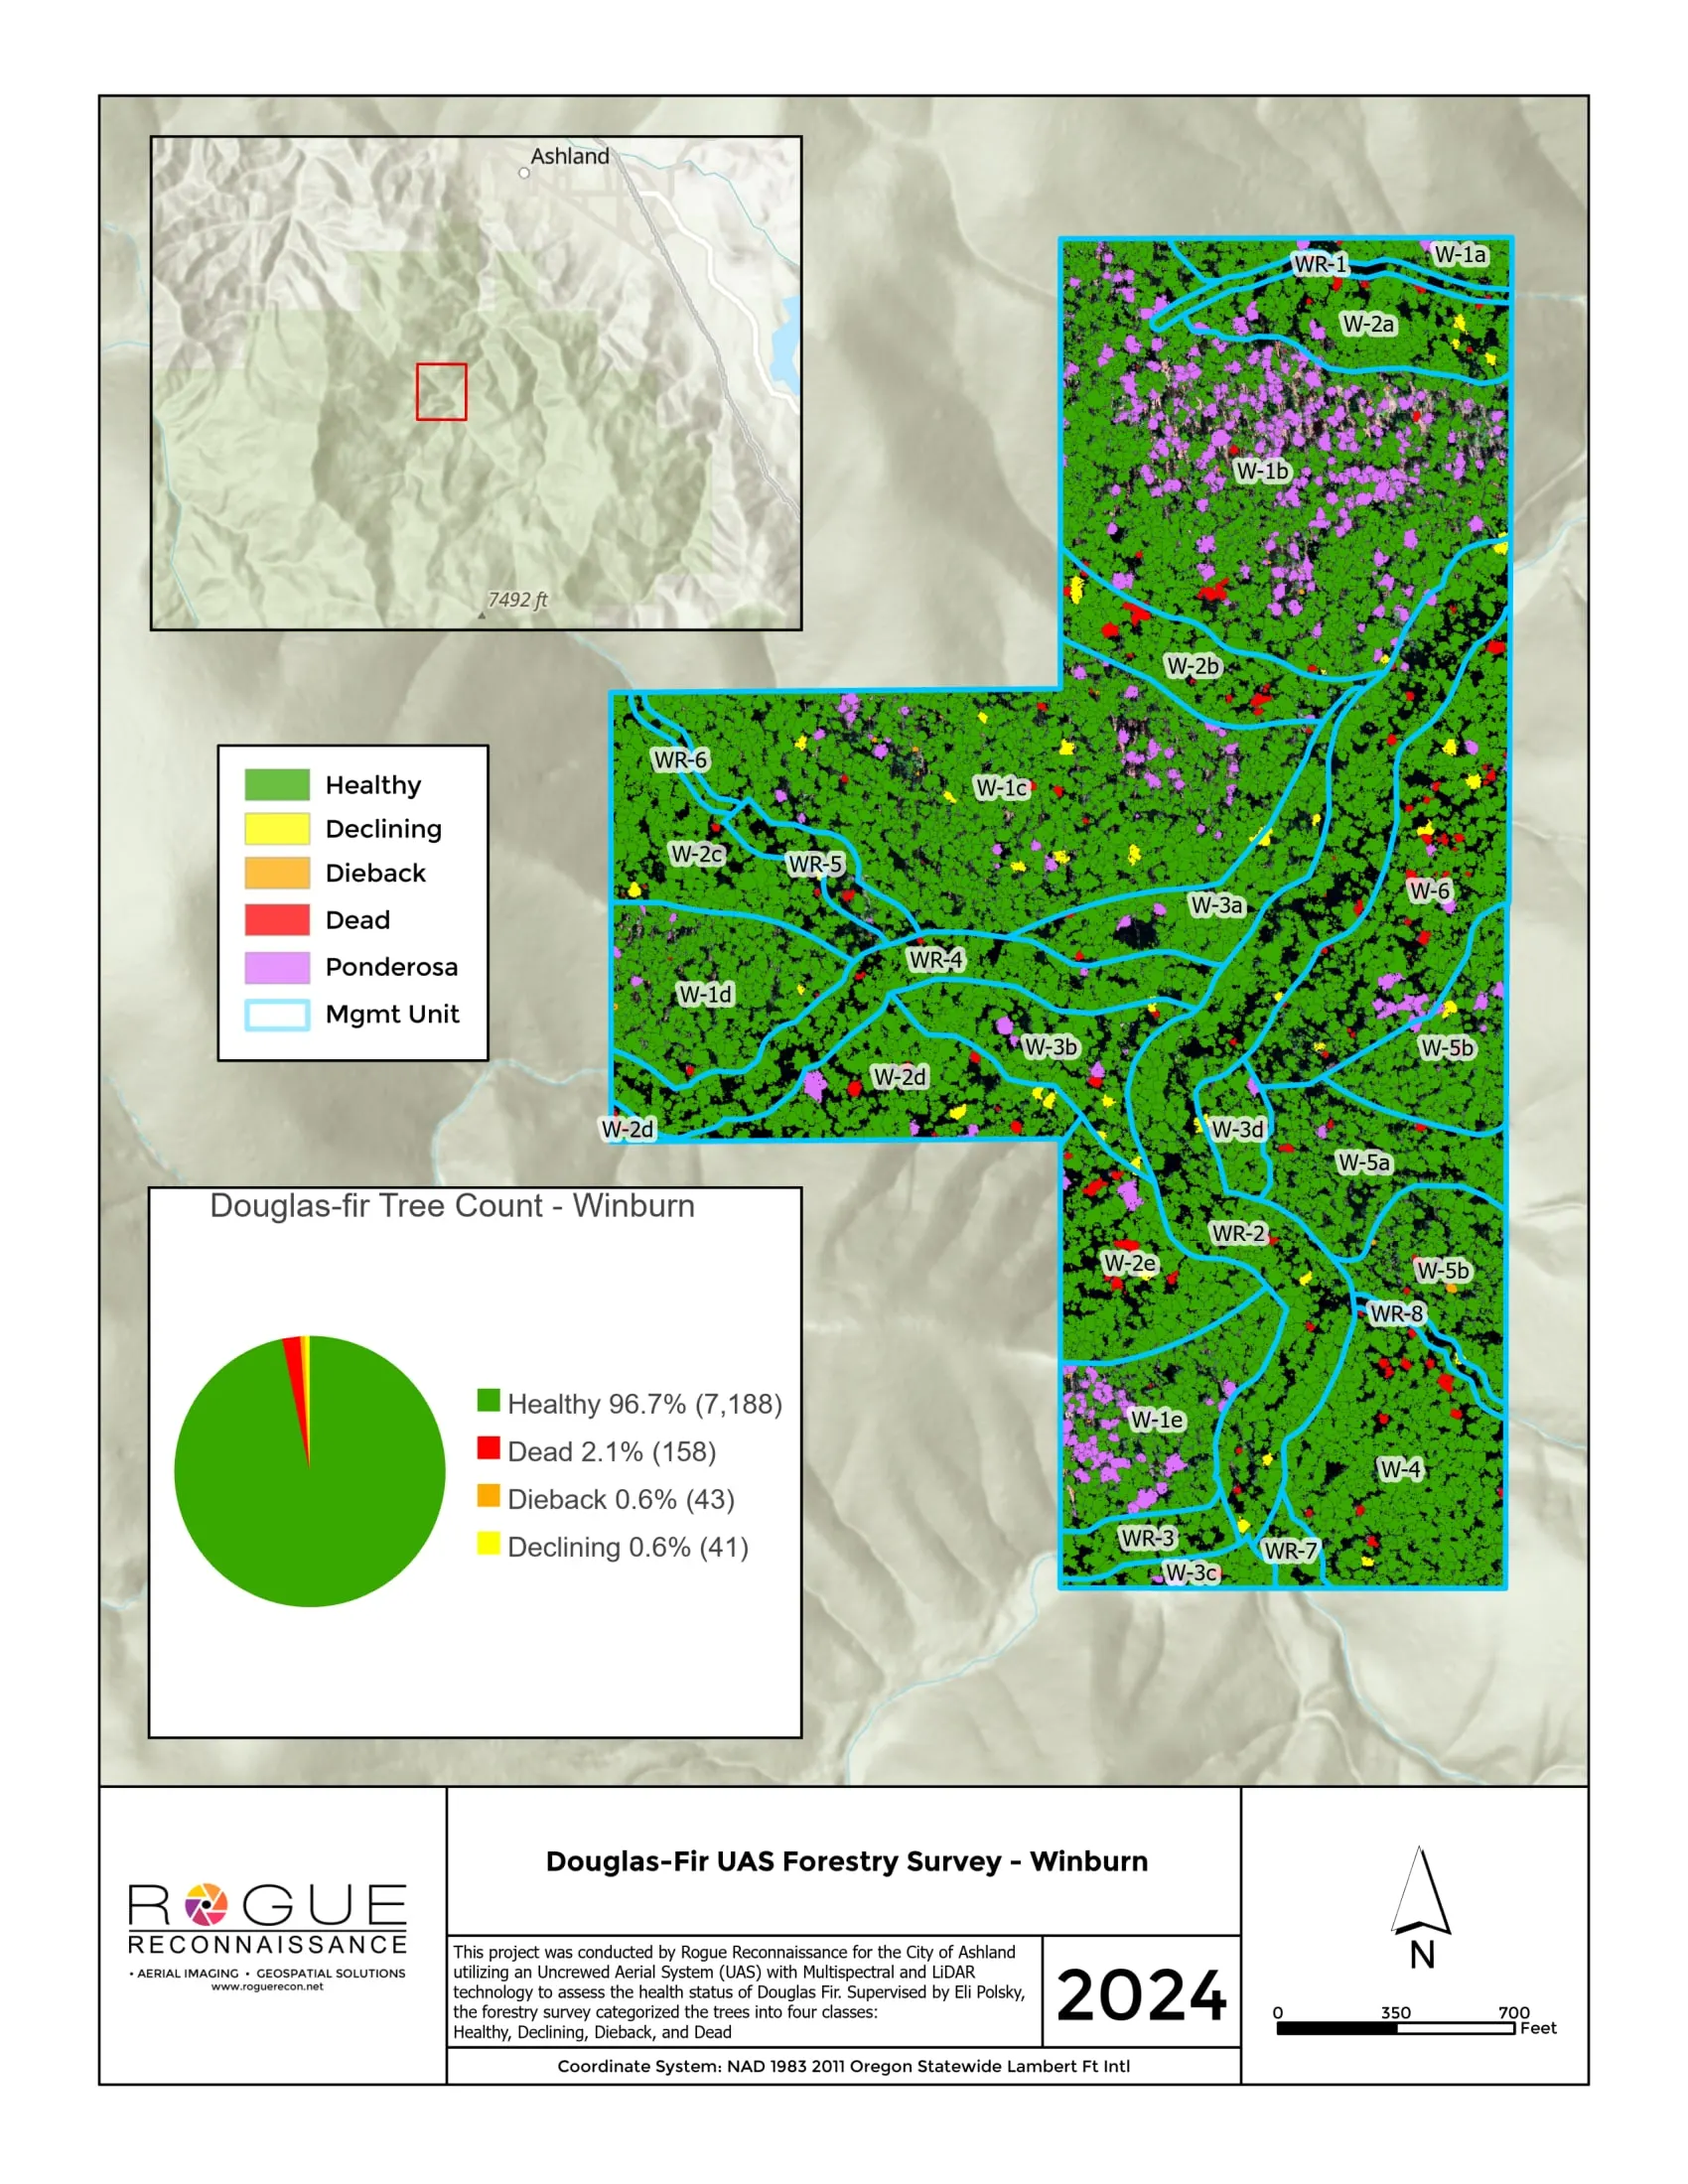
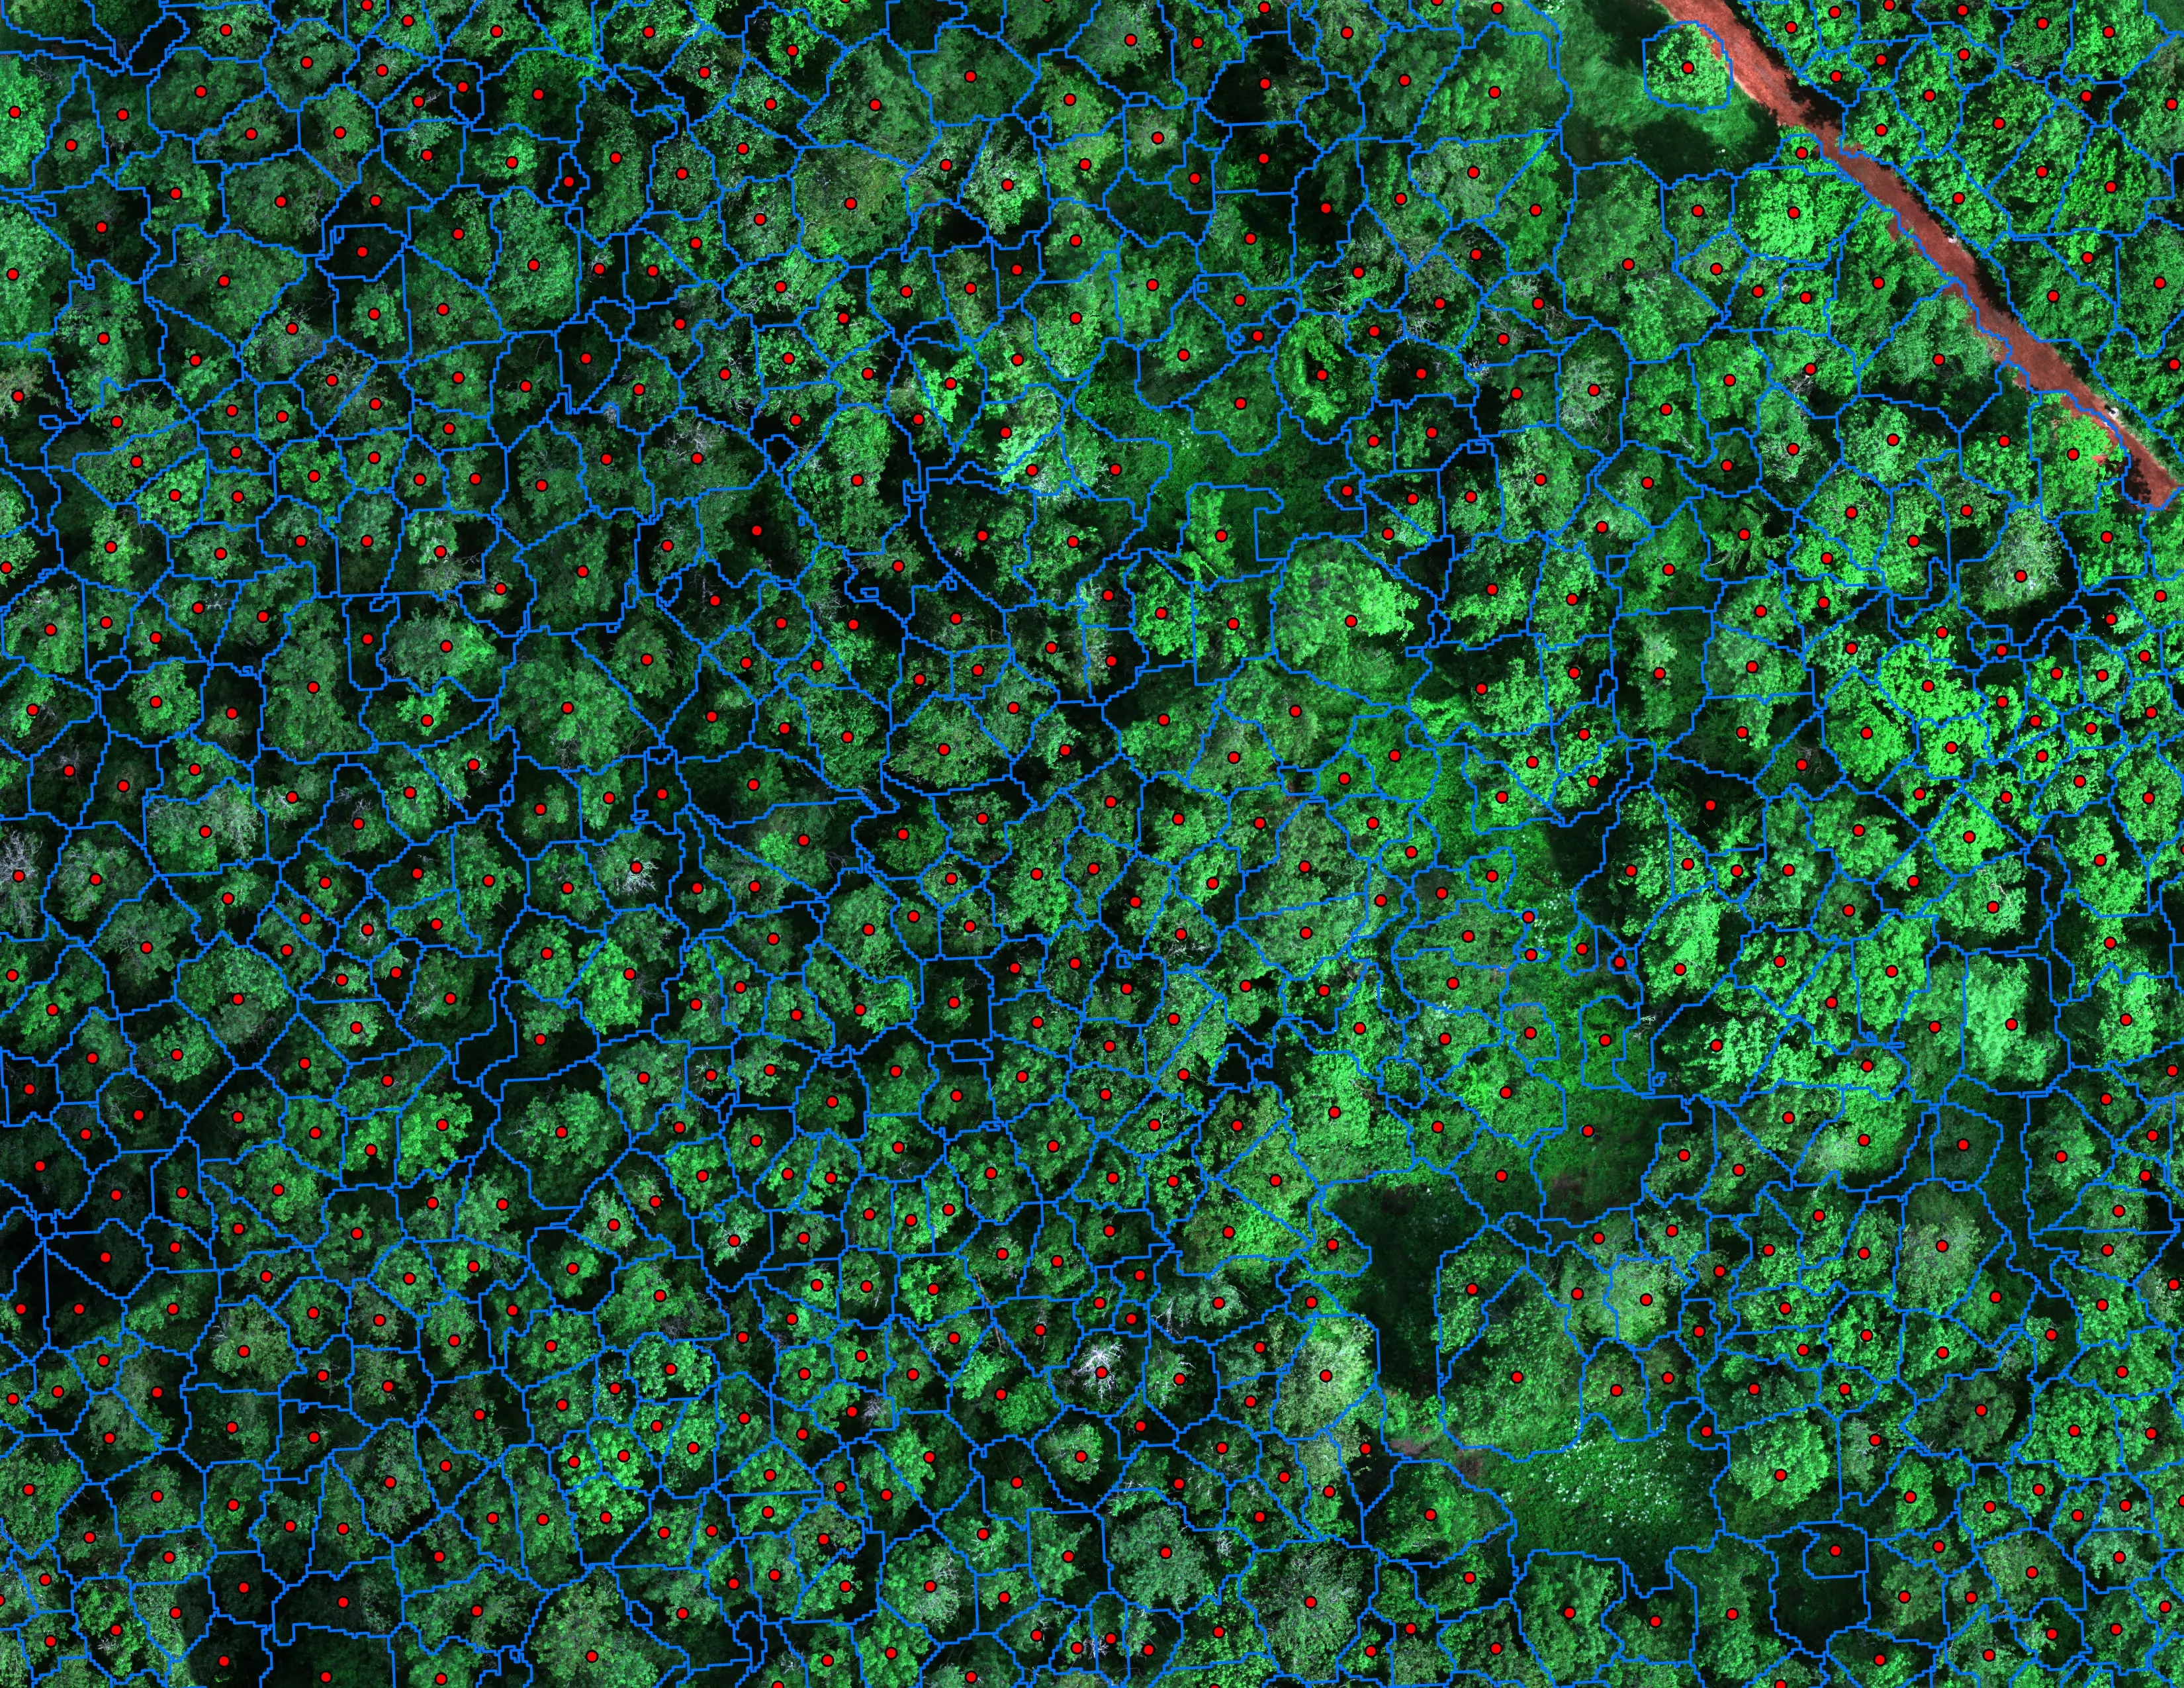
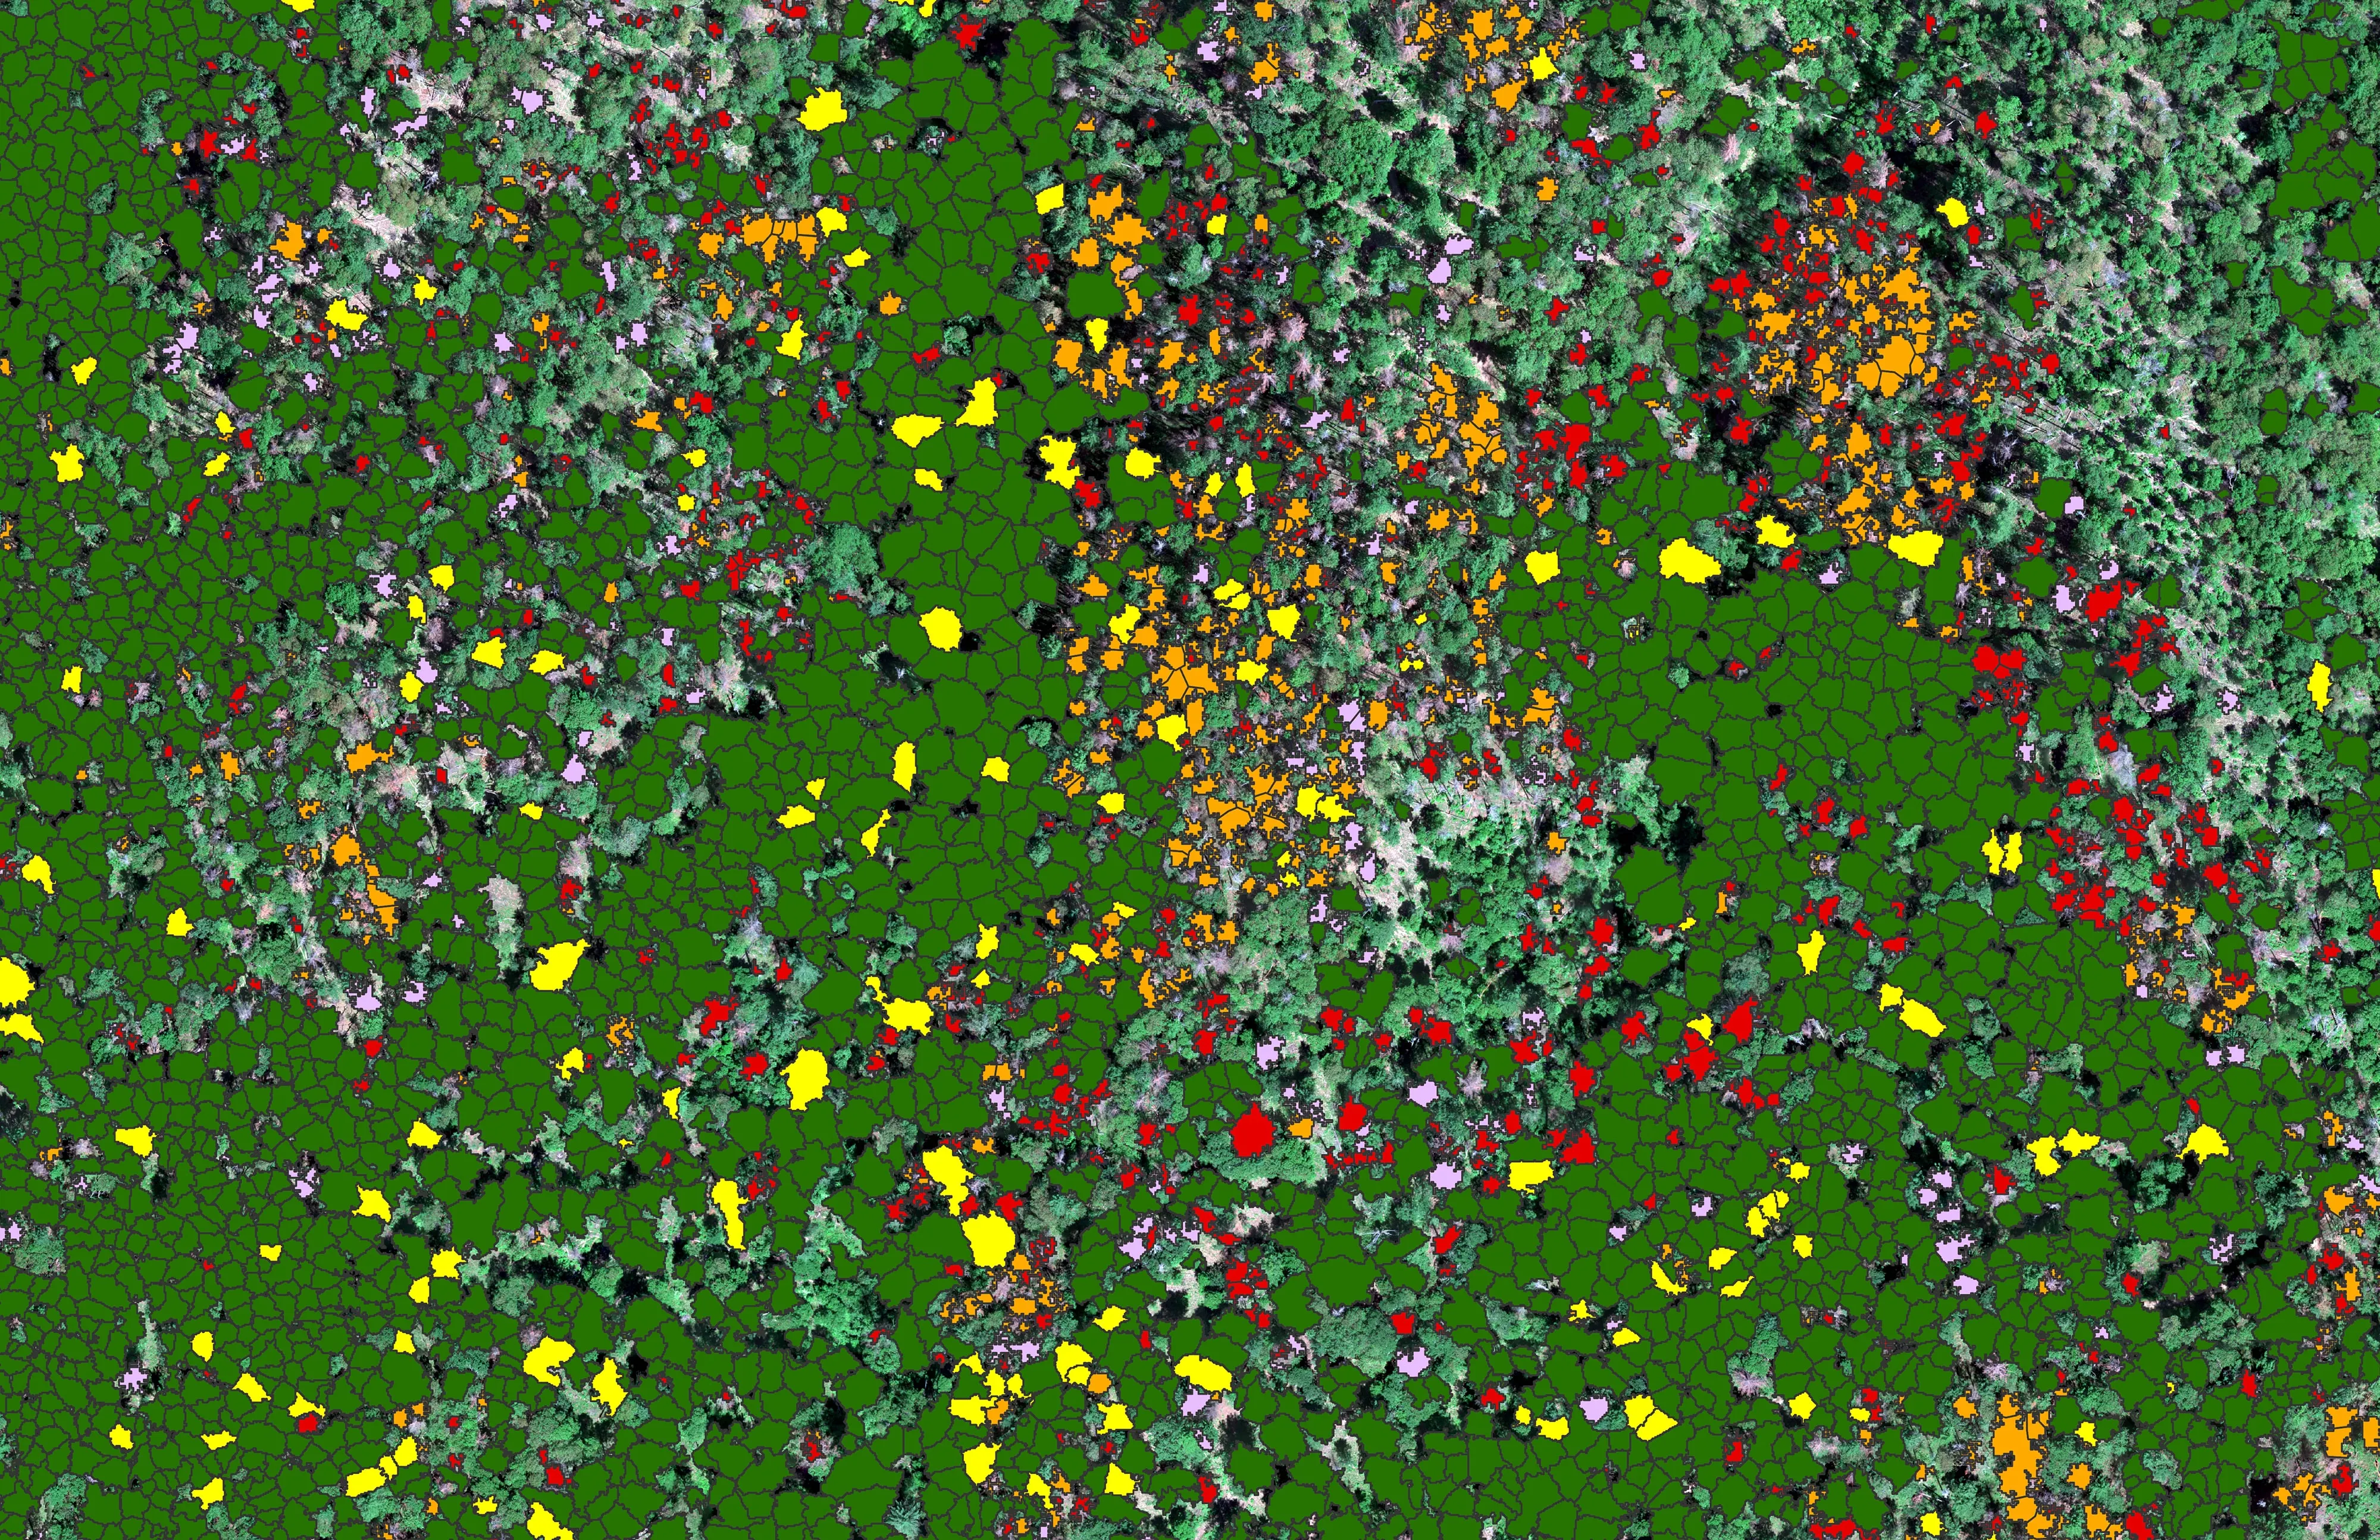
- Every Douglas fir crown classed at risk, declining, dieback, or dead, with Ponderosa pine separated out
- Per tree attributes for species and height
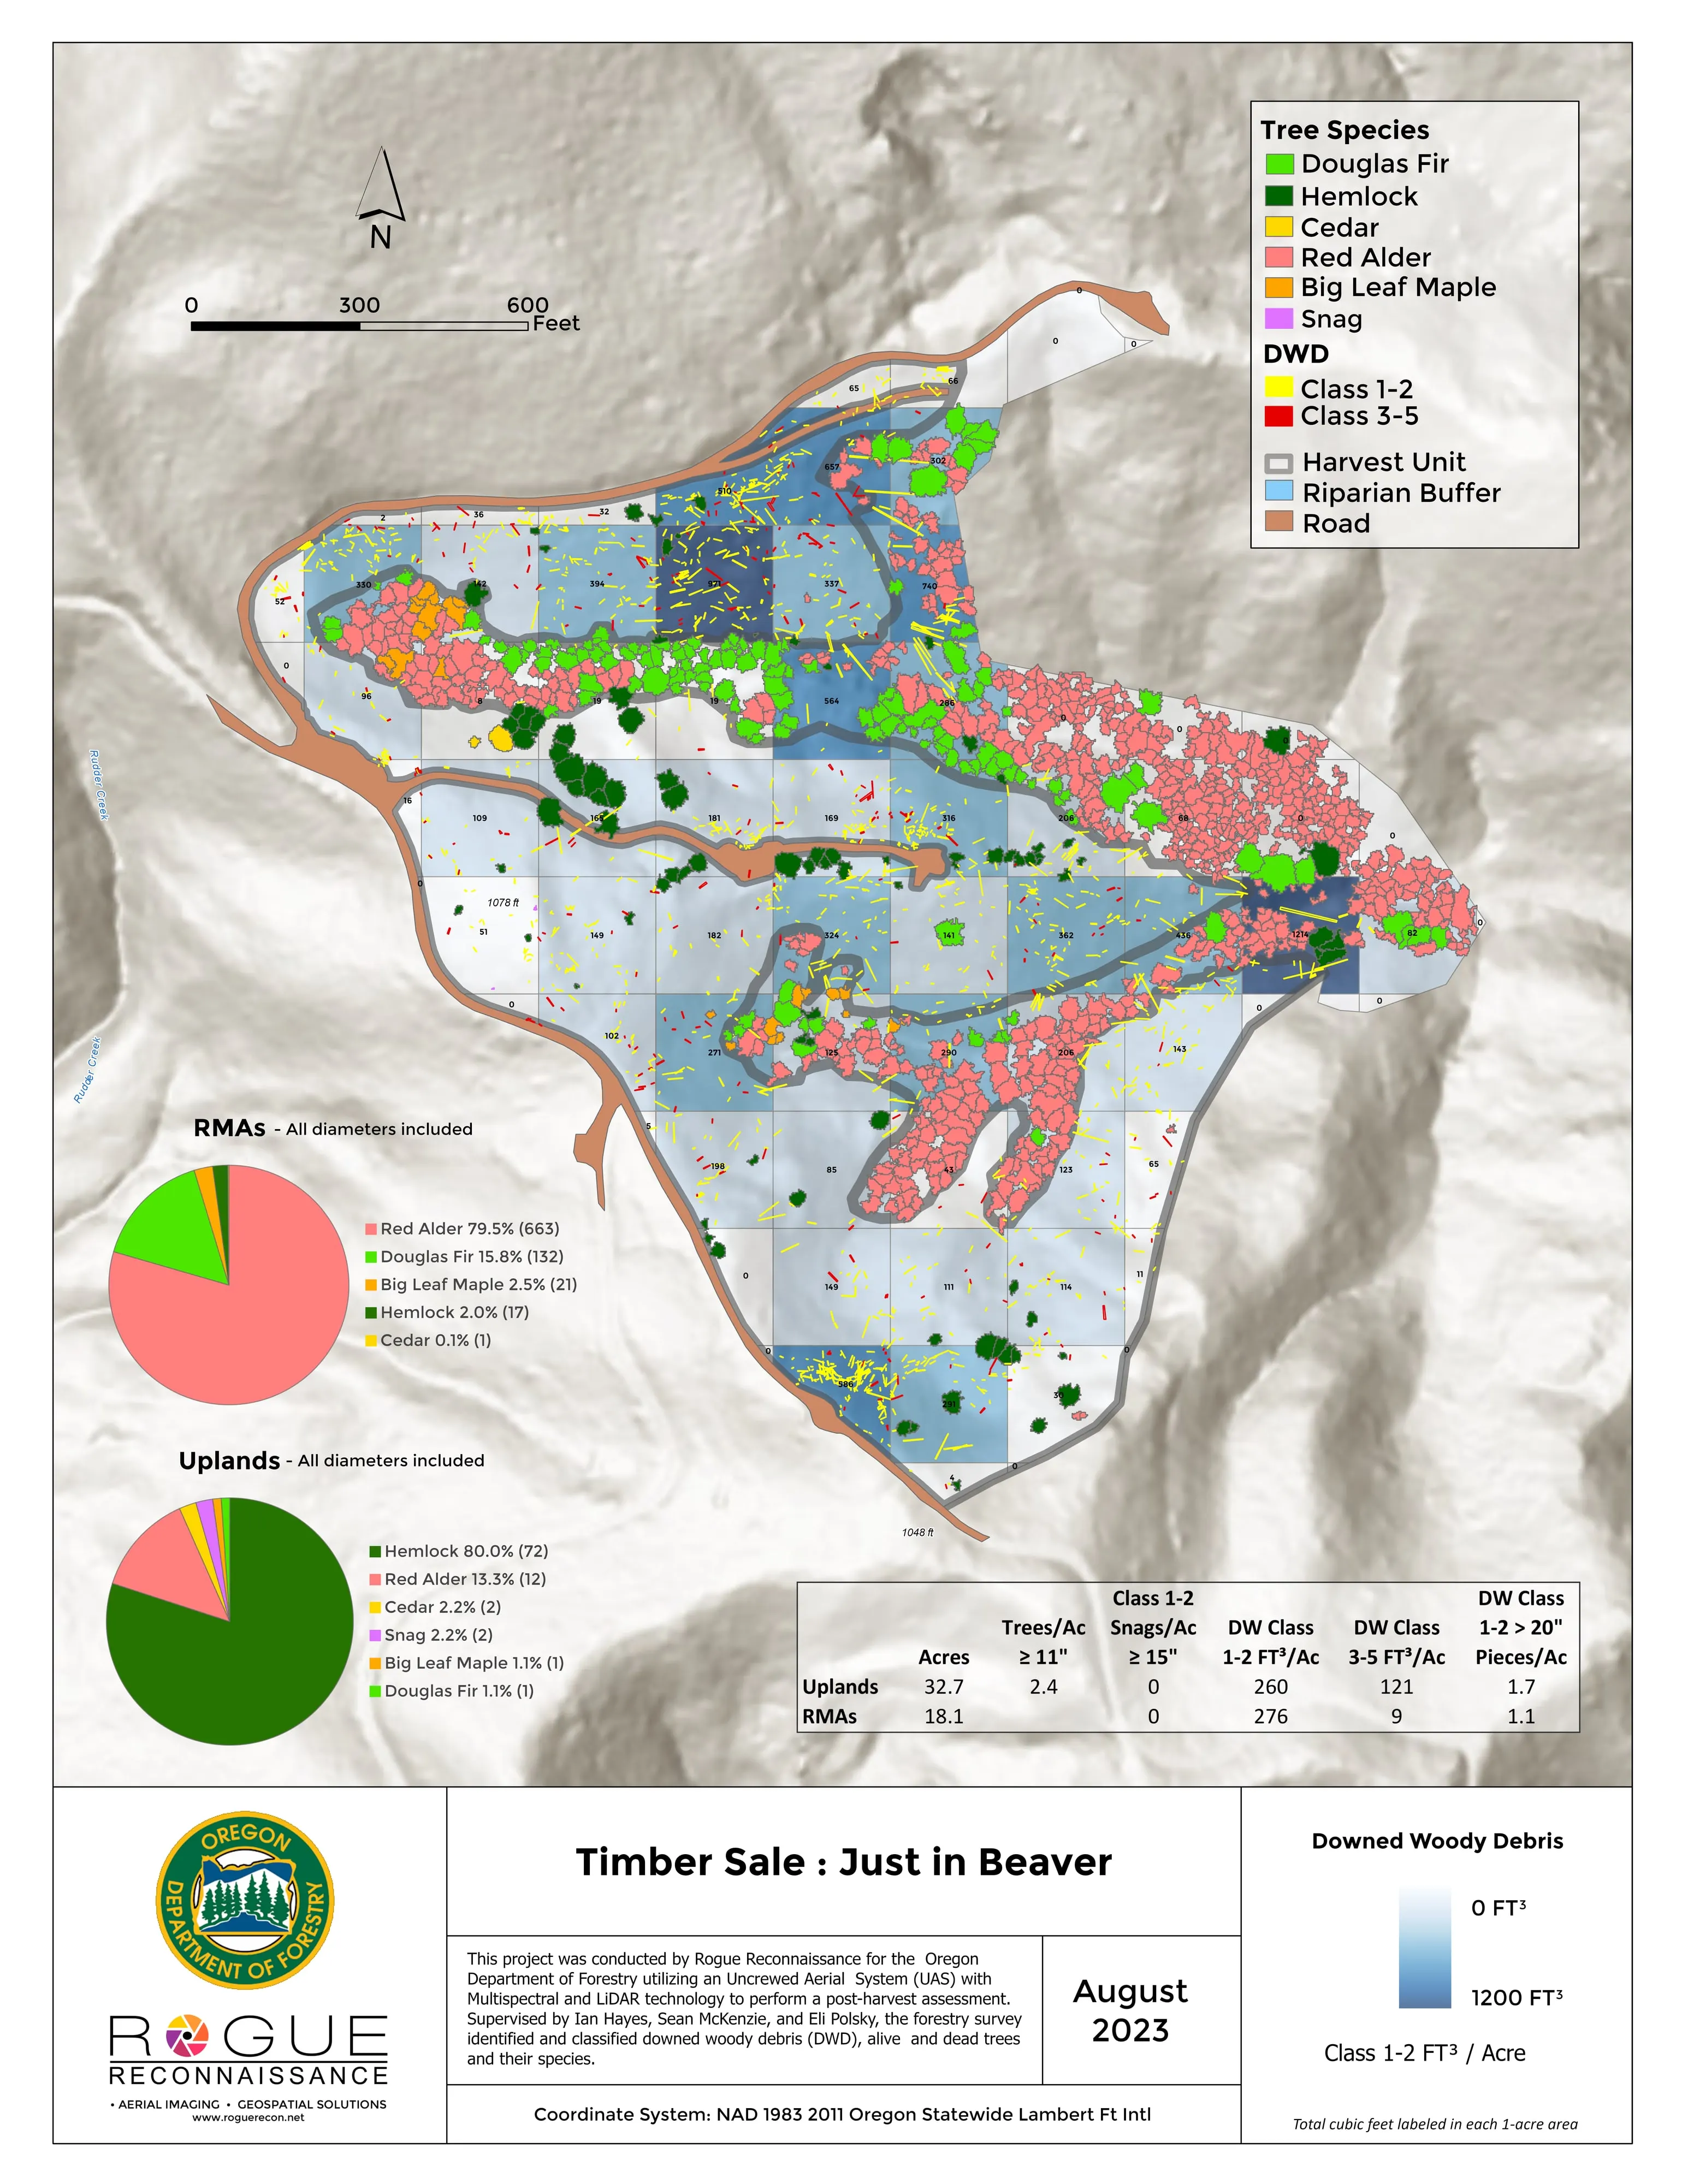
- Overview and per area maps with the tally on each sheet, for Siskiyou Mountain Park, four watershed sections, and Winburn
- Bar charts per area and a geodatabase the city's GIS staff work from
A forester deciding where to send a crew, or where the risk to a trail or a road is, needs to know the difference between a tree that is declining and one that is already dead. So the product is a count by class per area, with the map behind it.
The city published the 2023 findings and acted on them: dead trees came out by helicopter on about 400 acres in the spring of 2024, and the October 2024 count is what was left standing. That is what a count like this is for.