
The problem
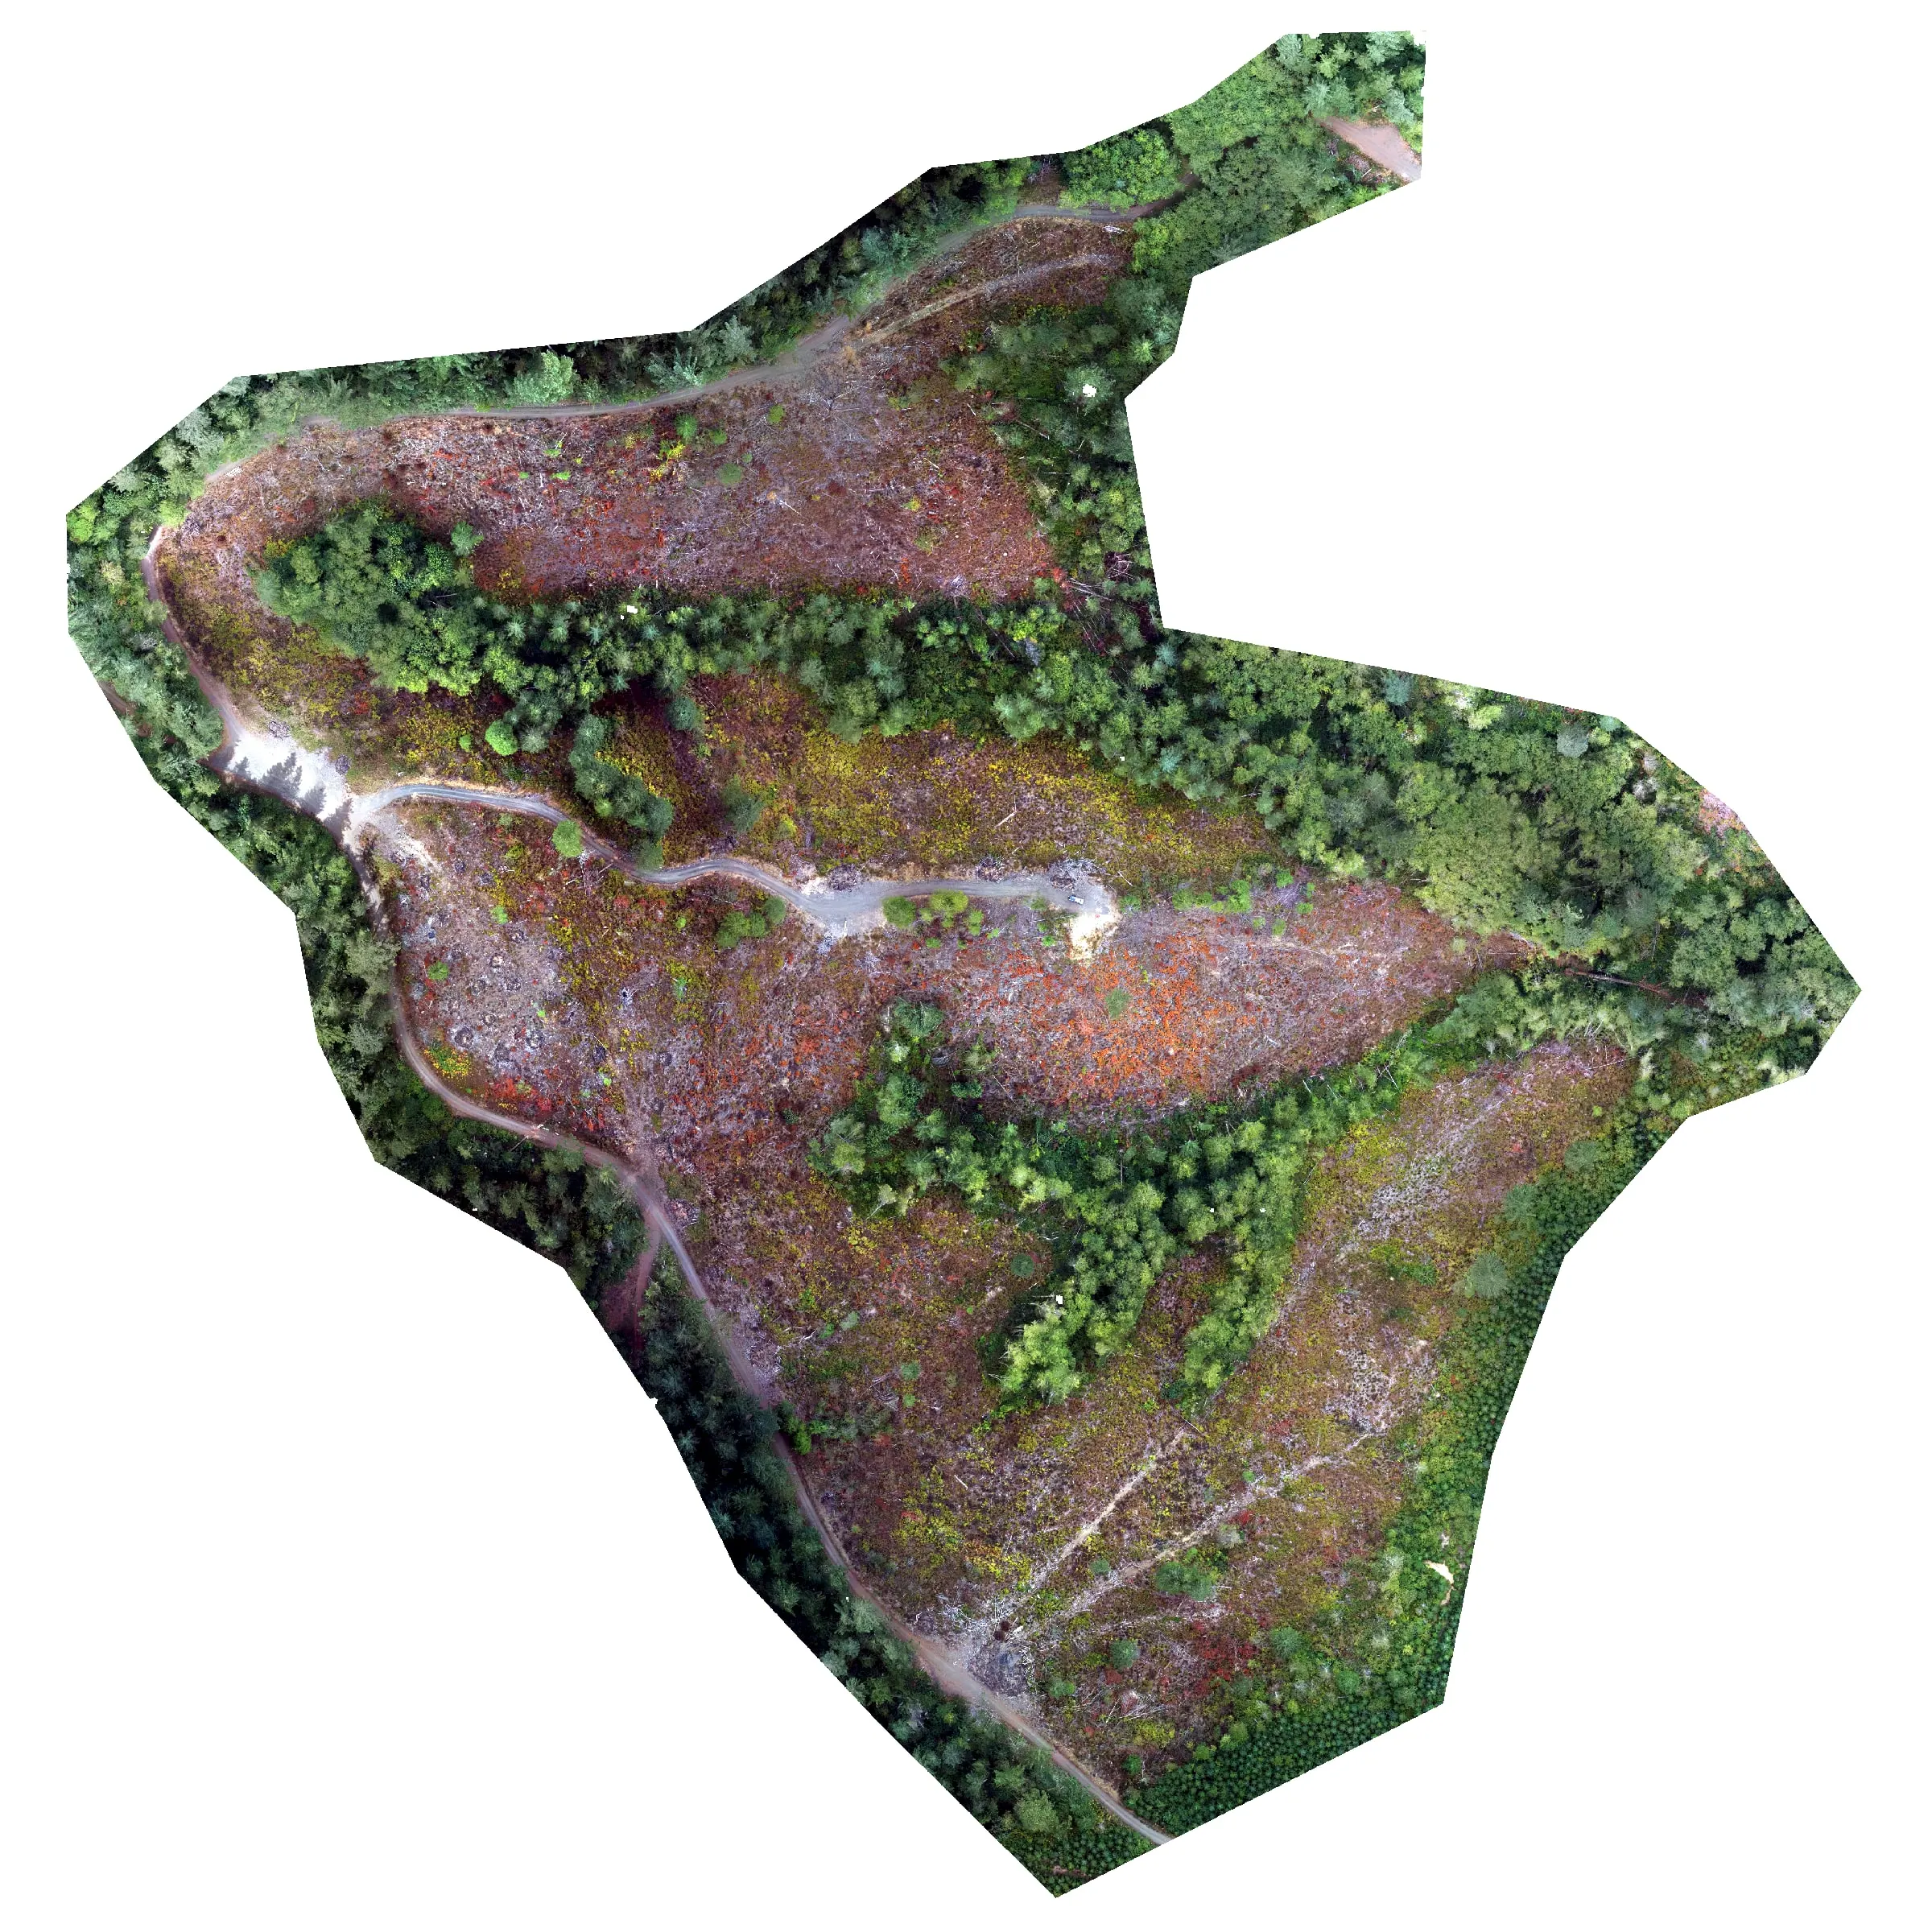
After a harvest, ODF needs to know how much downed woody debris was left on the unit, in what size and decay classes, and what the standing trees are. Transects sample a few strips of it and take a crew a day. We measured all of it from one flight.
What we flew
- RGB orthomosaic and LiDAR for structure
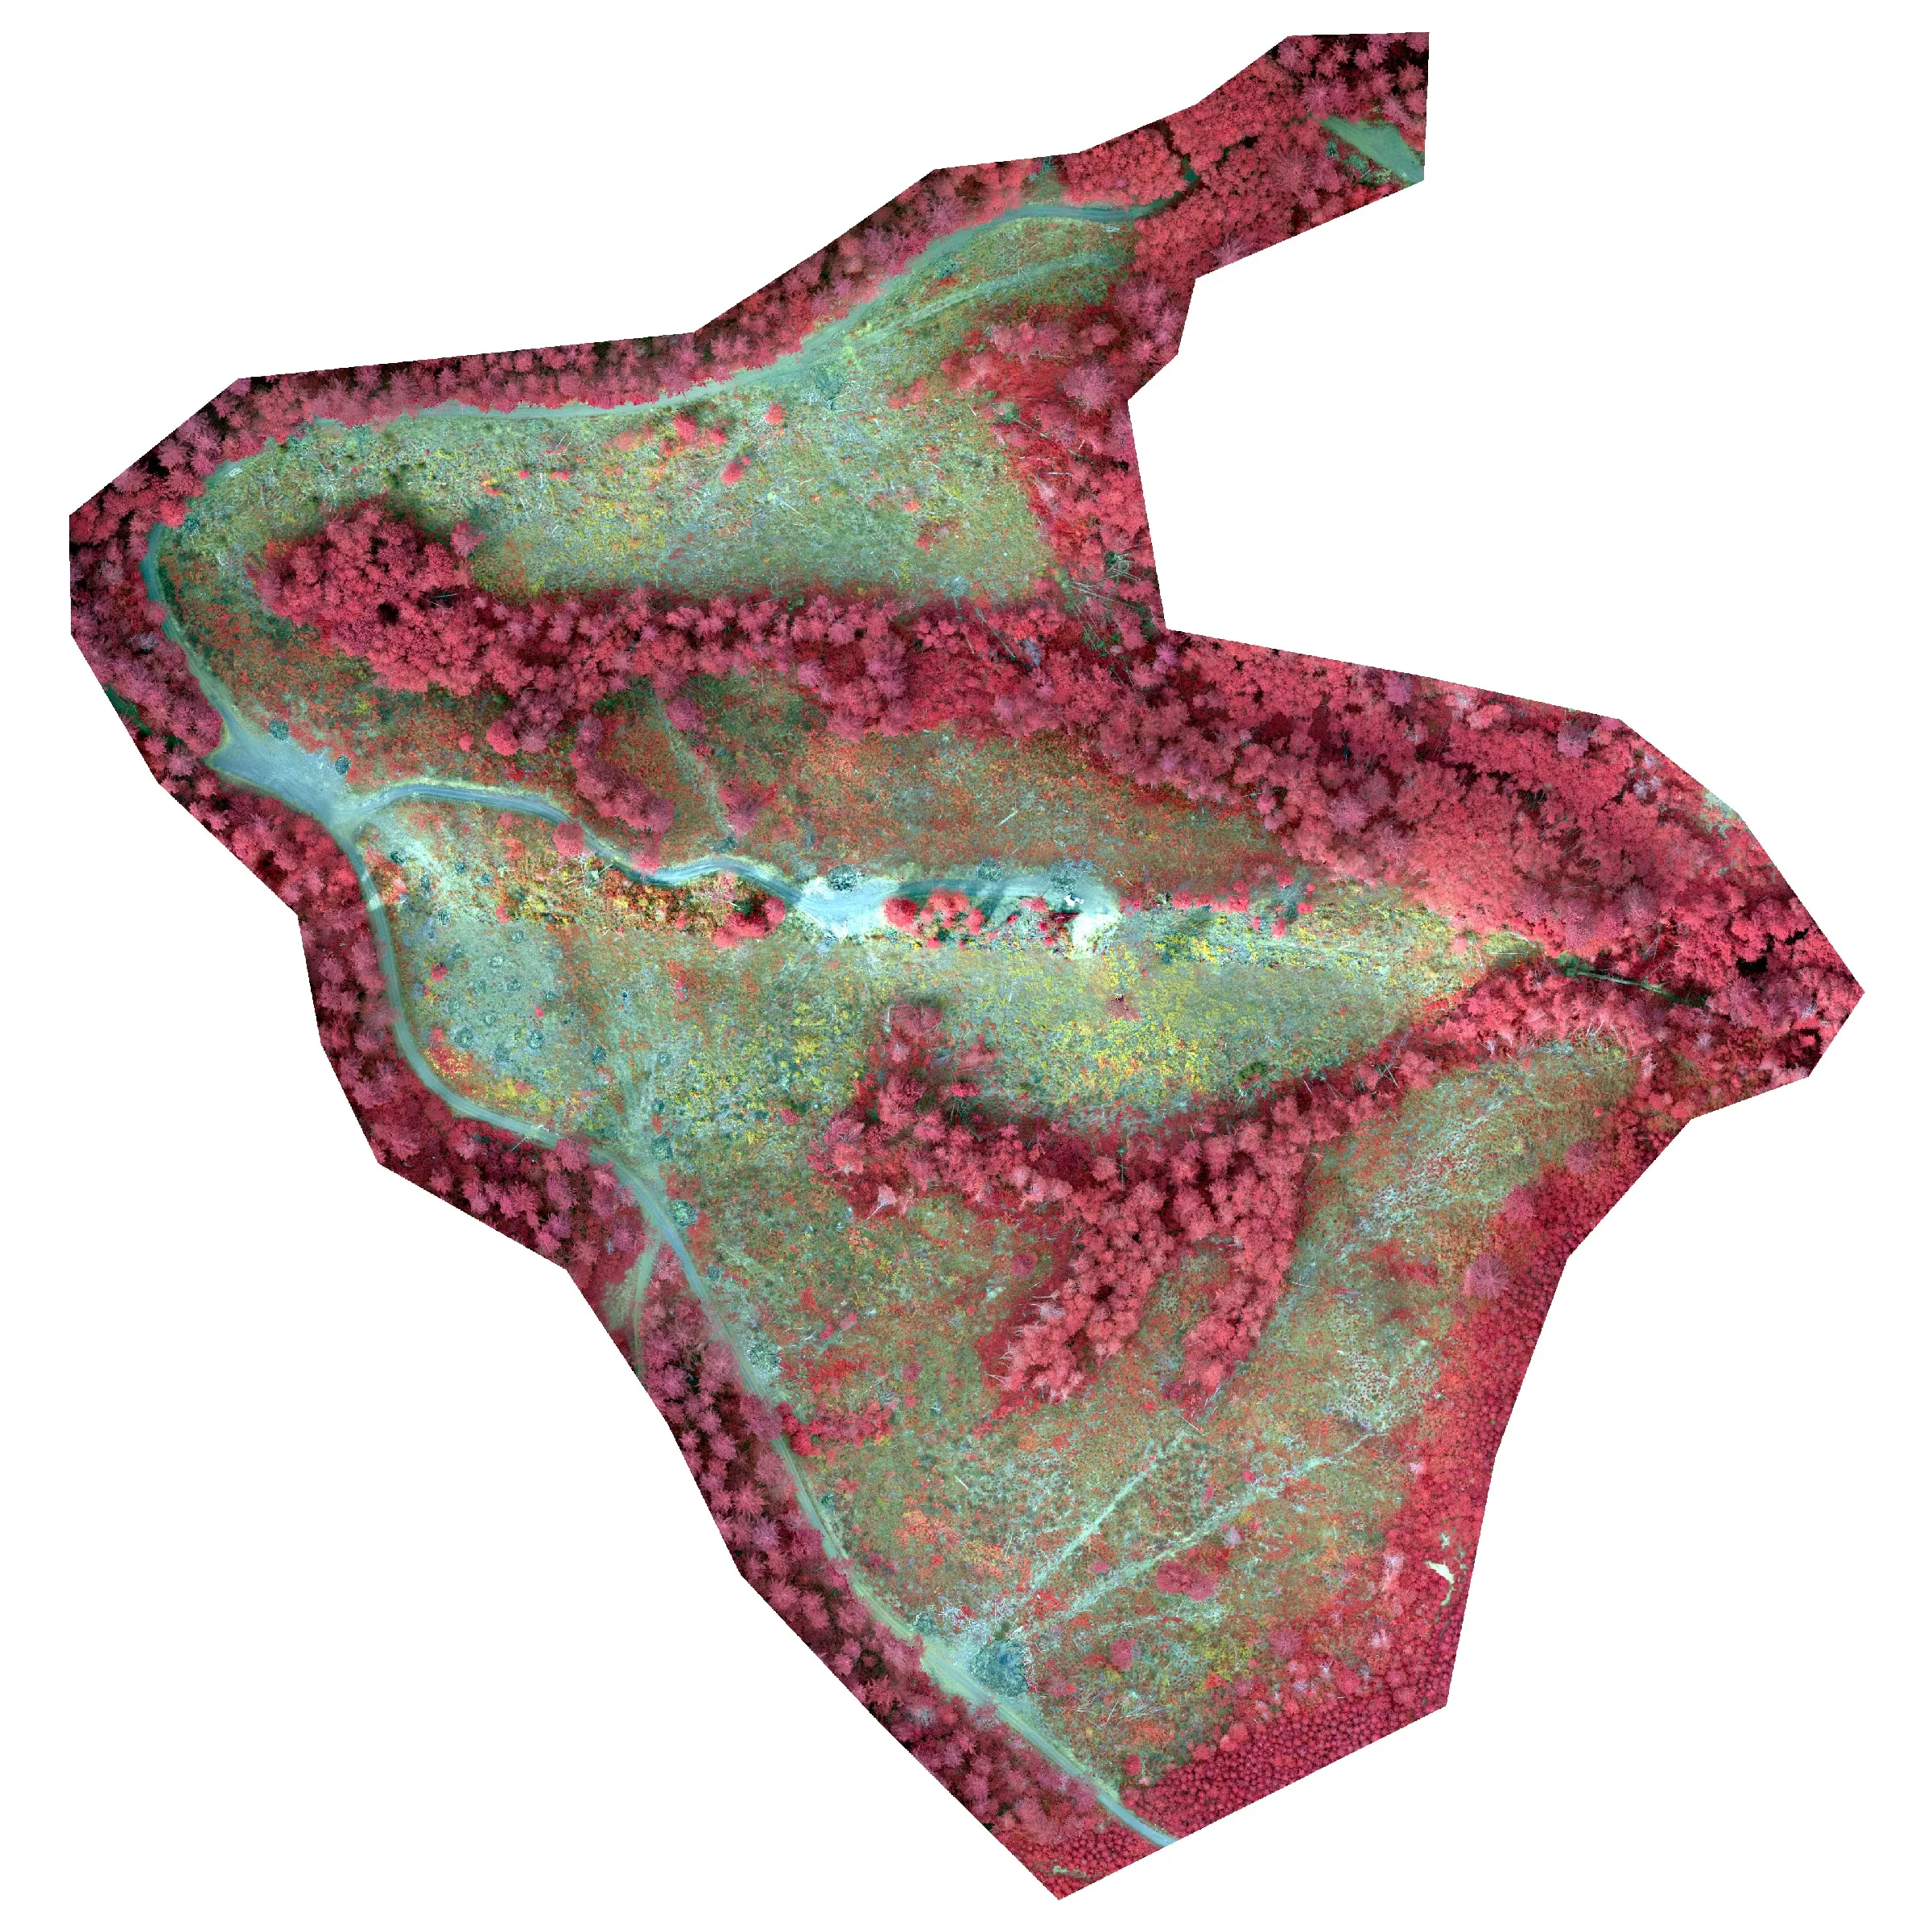
- MicaSense RedEdge MX multispectral for species of standing trees
- Flown in August, processed and mapped in Oregon Statewide Lambert with imperial units so volumes come out in the units the contract uses
What we delivered
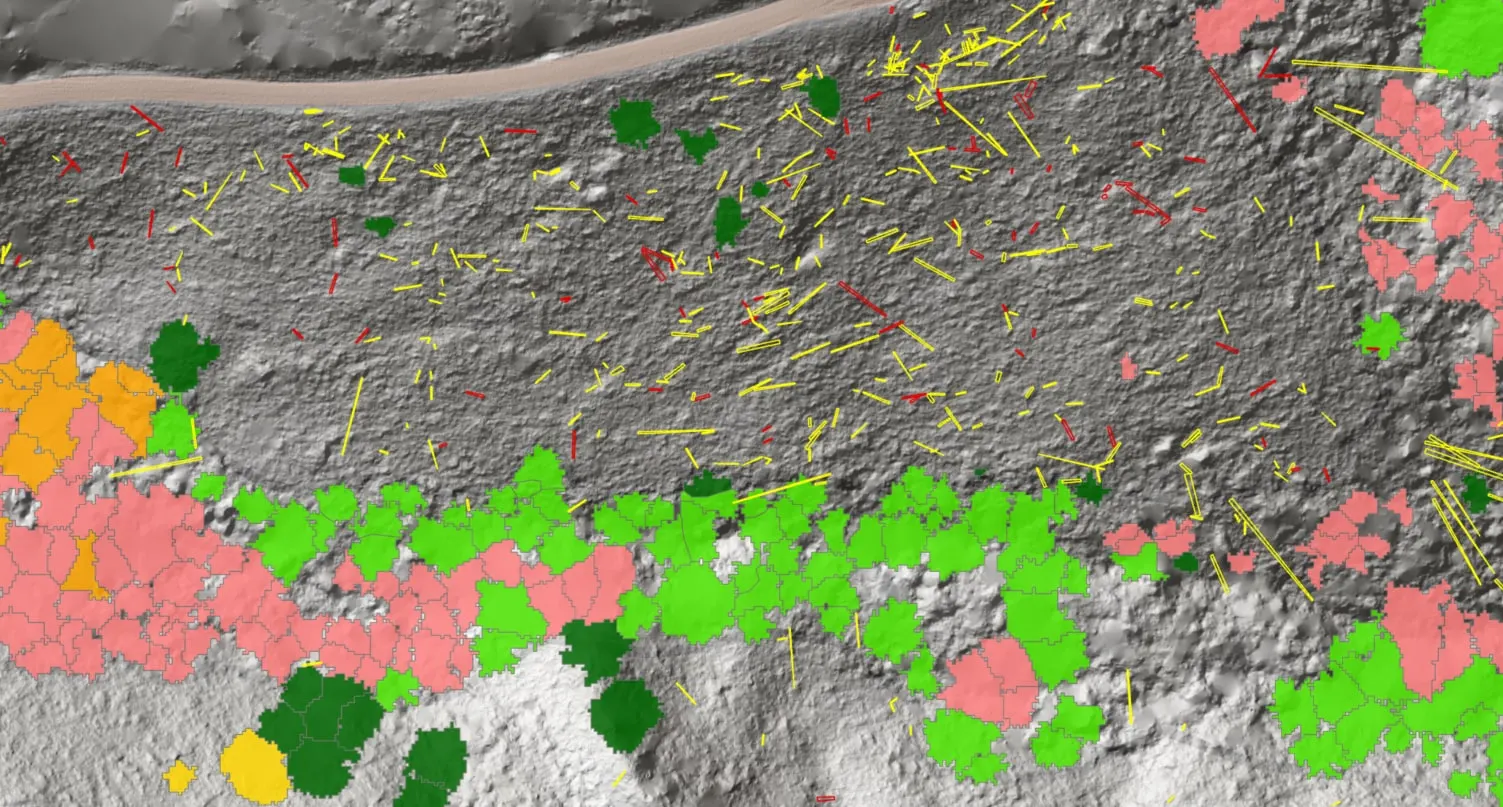
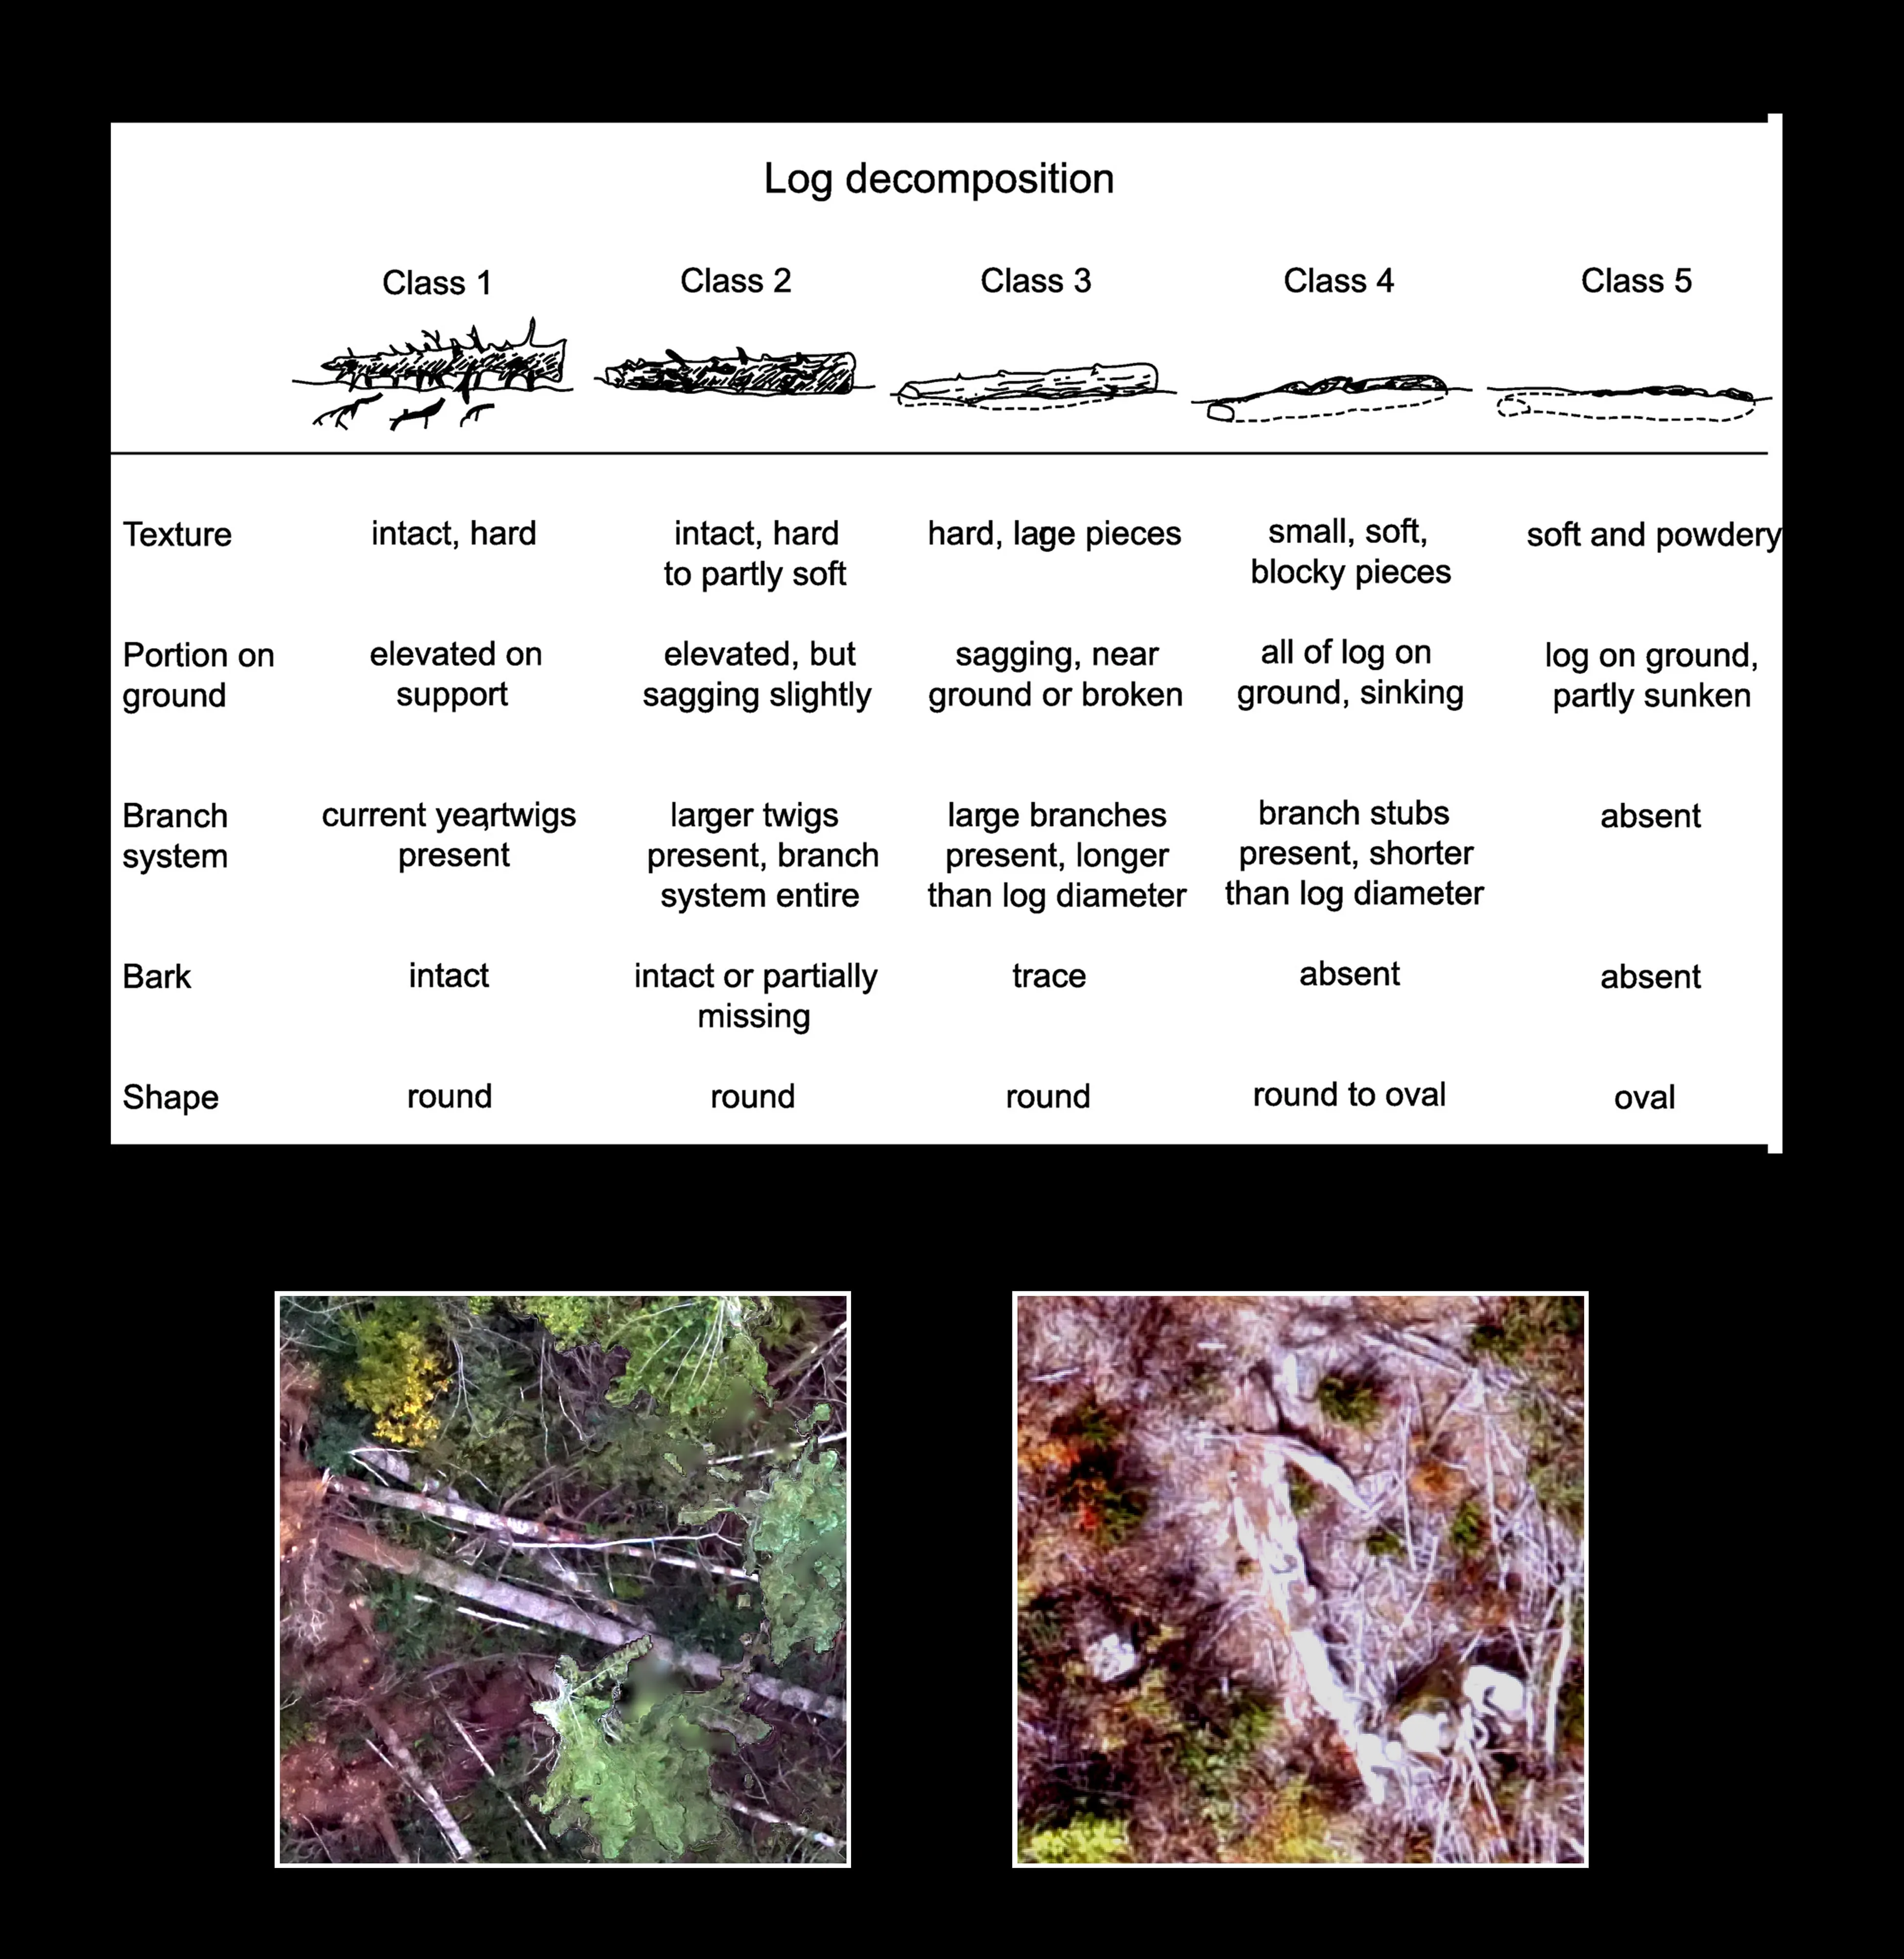
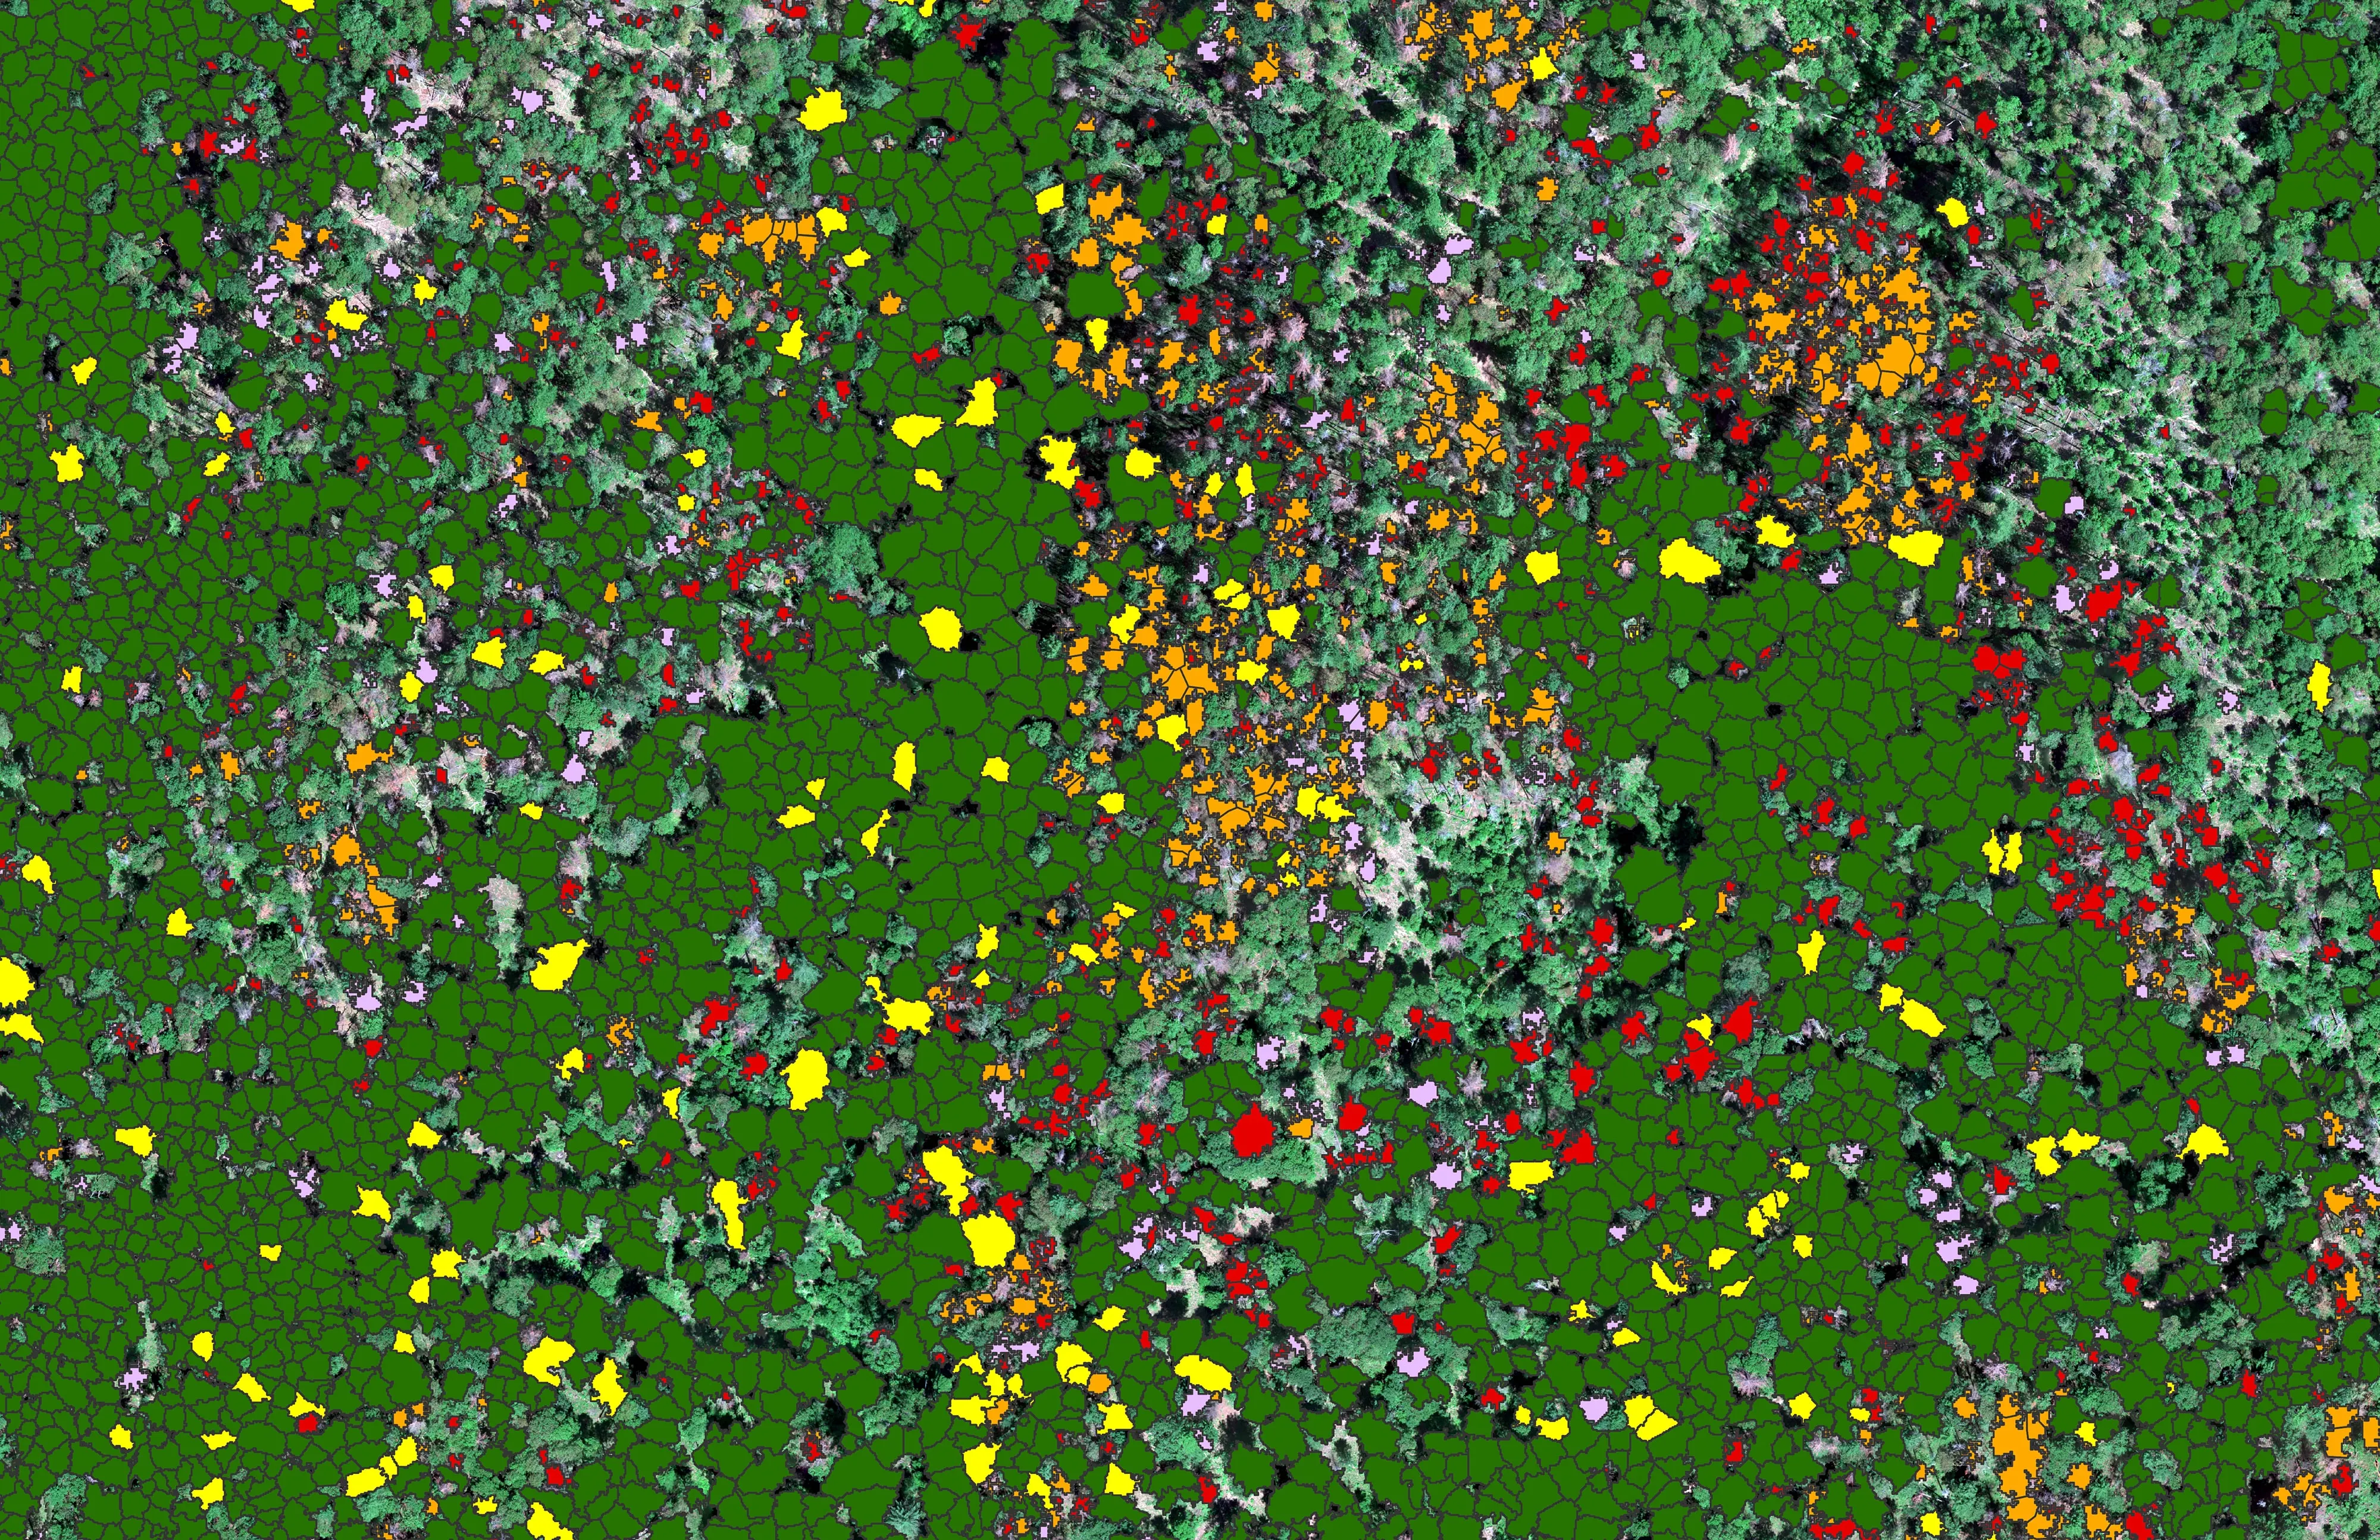
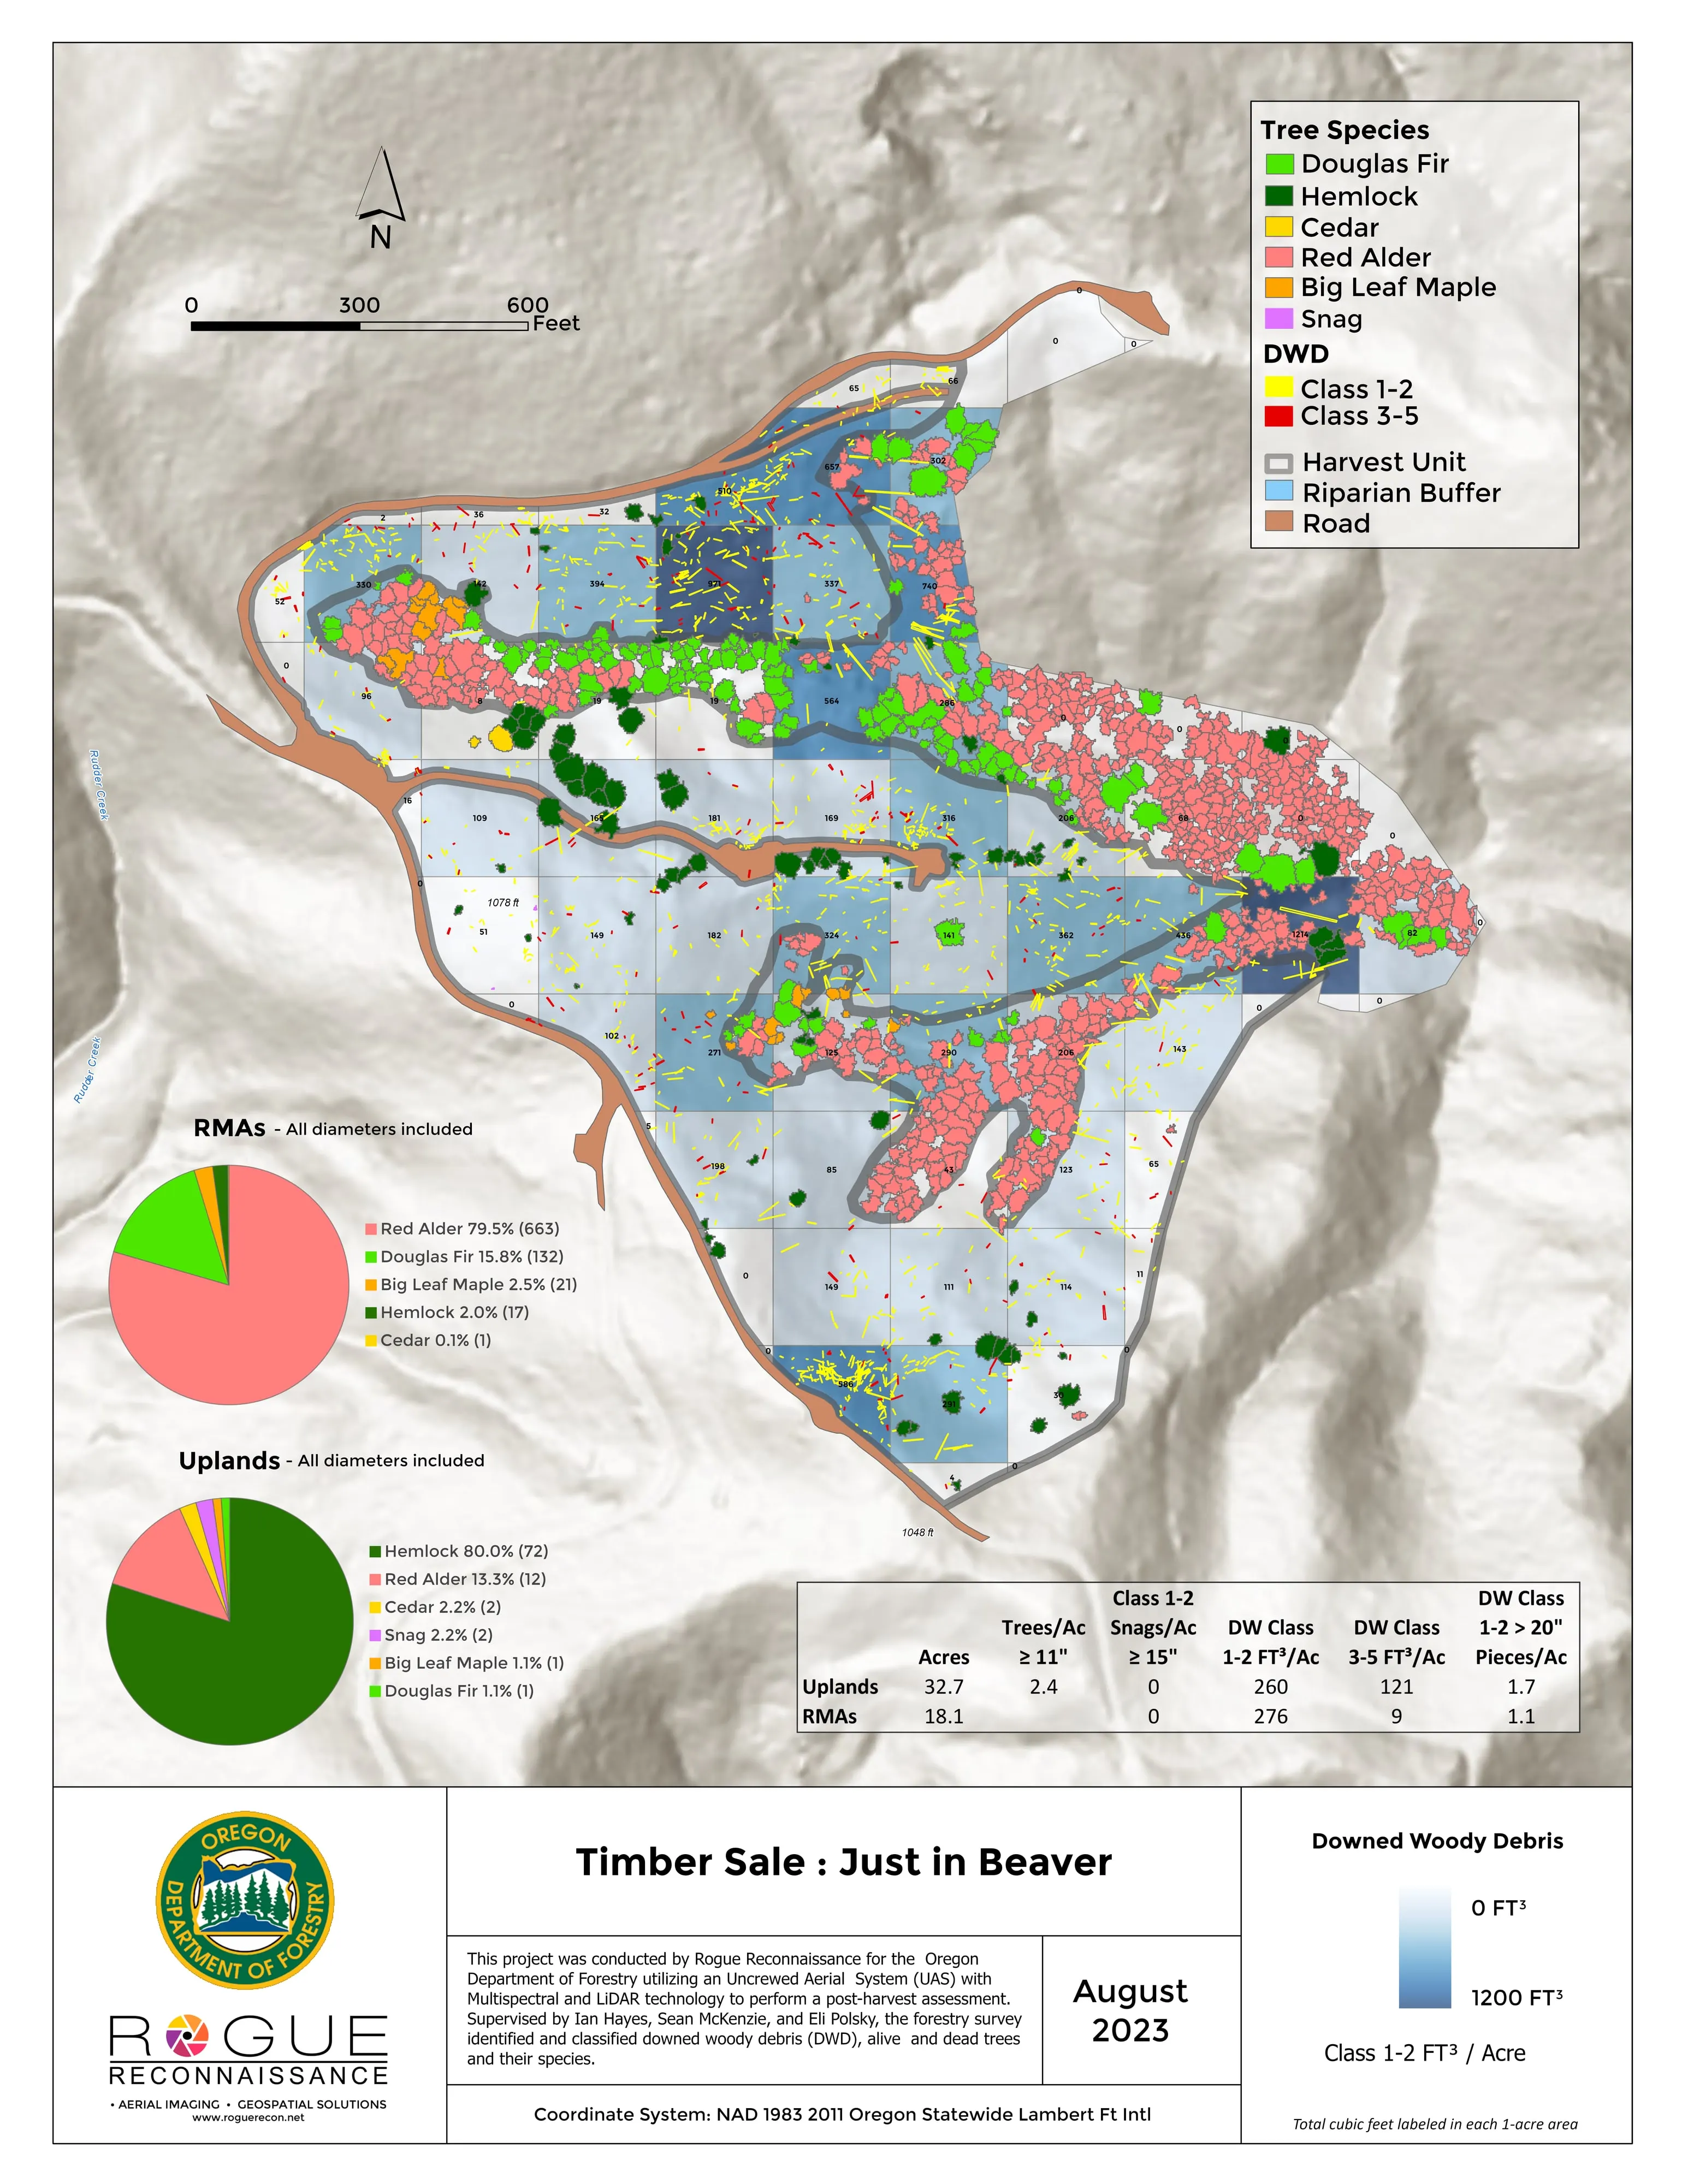
- Every piece of downed woody debris delineated and attributed with decay class and cubic feet
- Class 1 and 2 cubic feet per acre labeled in every one acre cell, with the class 3 to 5 totals by stratum, for the uplands and the riparian management areas separately
- Pieces per acre and trees per acre by diameter class
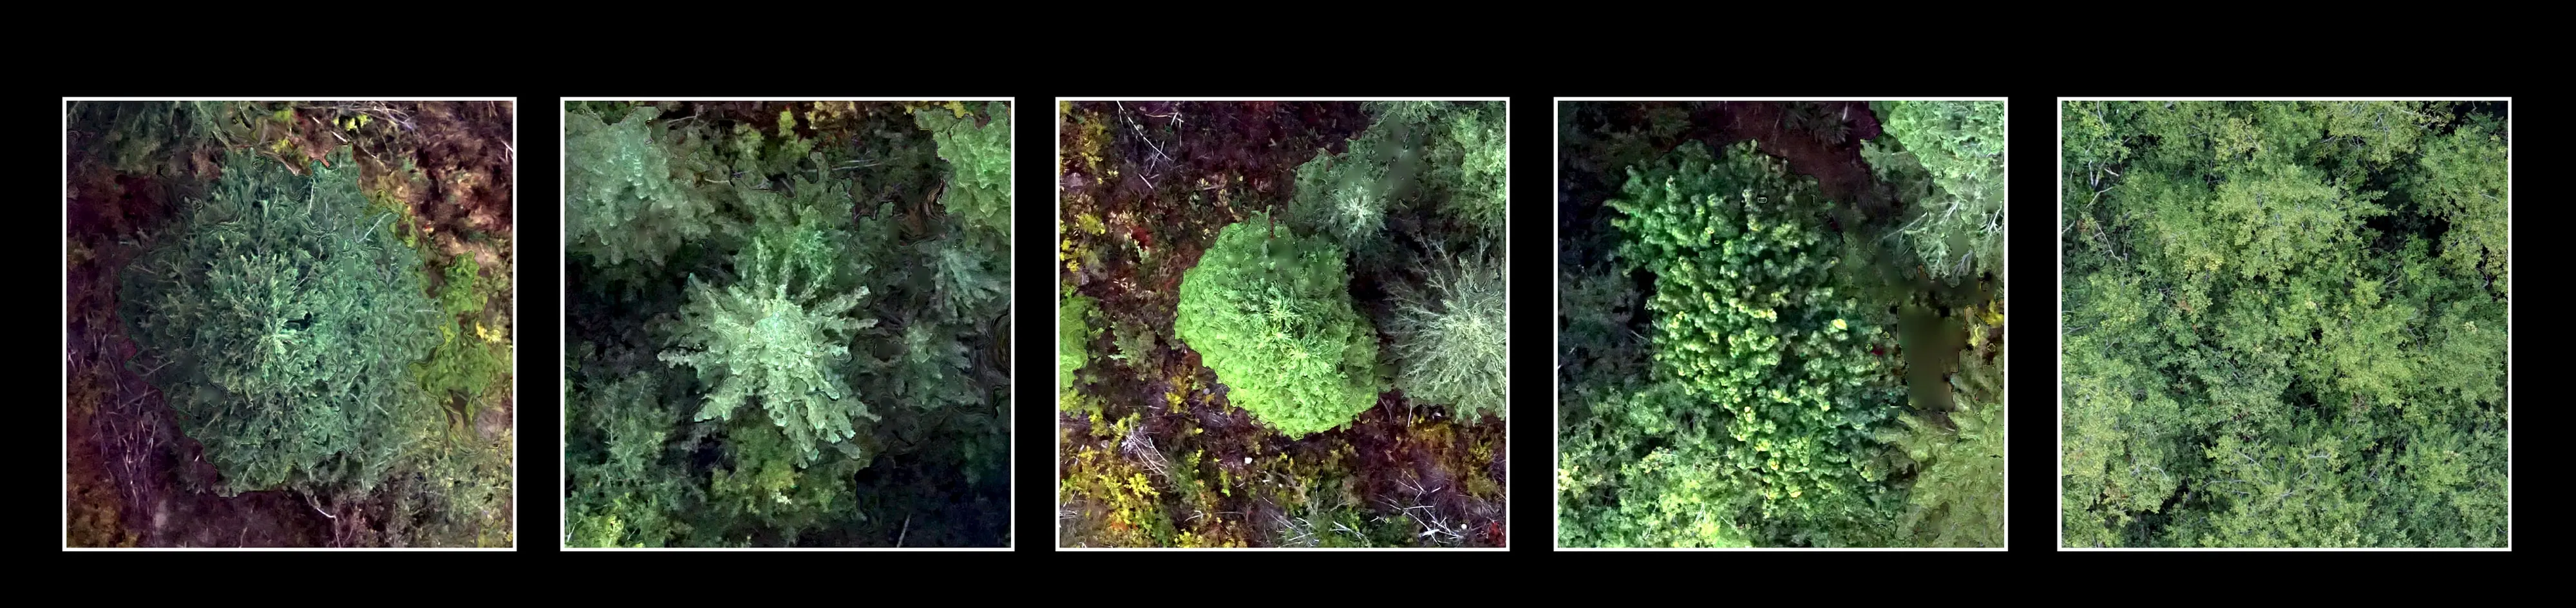
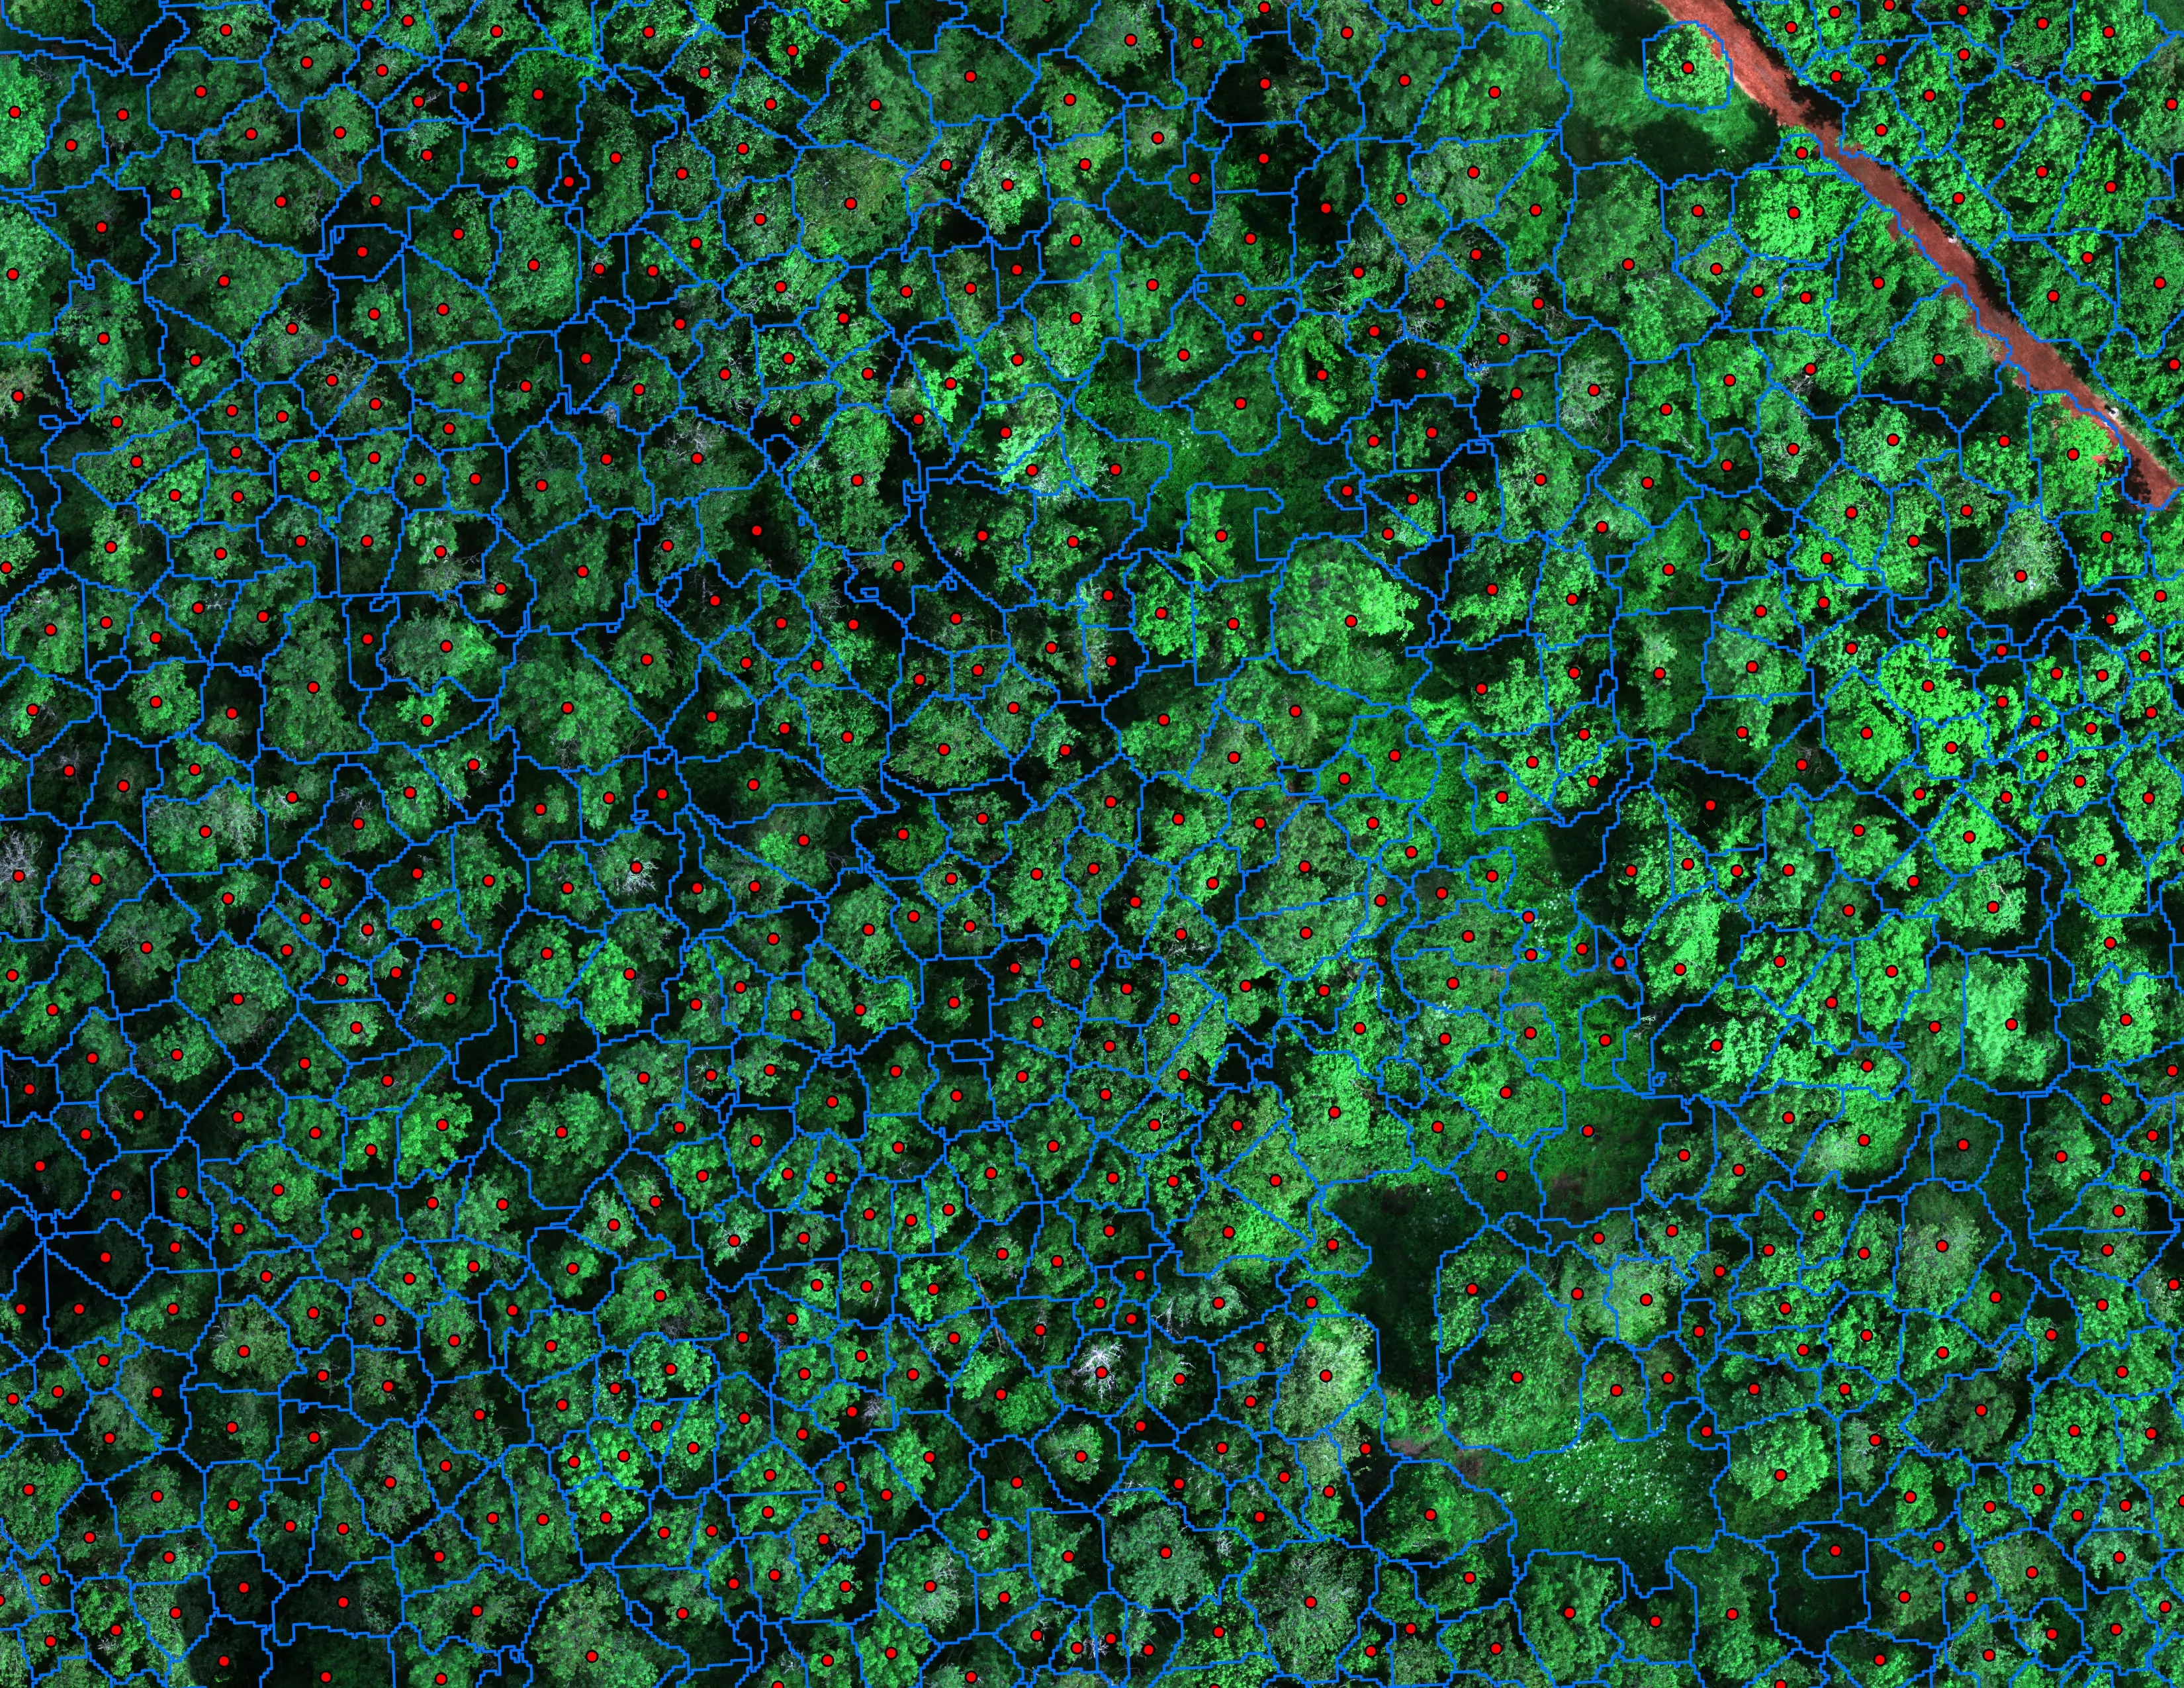
- Standing live and dead trees classified to species
- Riparian management areas carried through every product
- 17 by 22 map sheet, GeoPackage vectors, GeoTIFF rasters, and the classified LAS
The unit had two strata, uplands and riparian management areas, and the sheet answers both the same way: volume by decay class in every acre, and the standing trees by species. The riparian areas ran to red alder, the uplands to western hemlock, and each stratum carries its own species pie. Species came out at 94 percent against the field checks and decay class at 92 percent.
The species work runs on the multispectral bands; the debris work runs on the ortho and the LiDAR. One flight day covered both.
We showed the method at the Oregon Society of American Foresters annual meeting in Ashland in 2024.