

Forestry
Forest and vegetation intelligence at the tree level.
LiDAR, multispectral, and machine learning for stands, riparian corridors, and community wildfire planning.
Downed woody debris
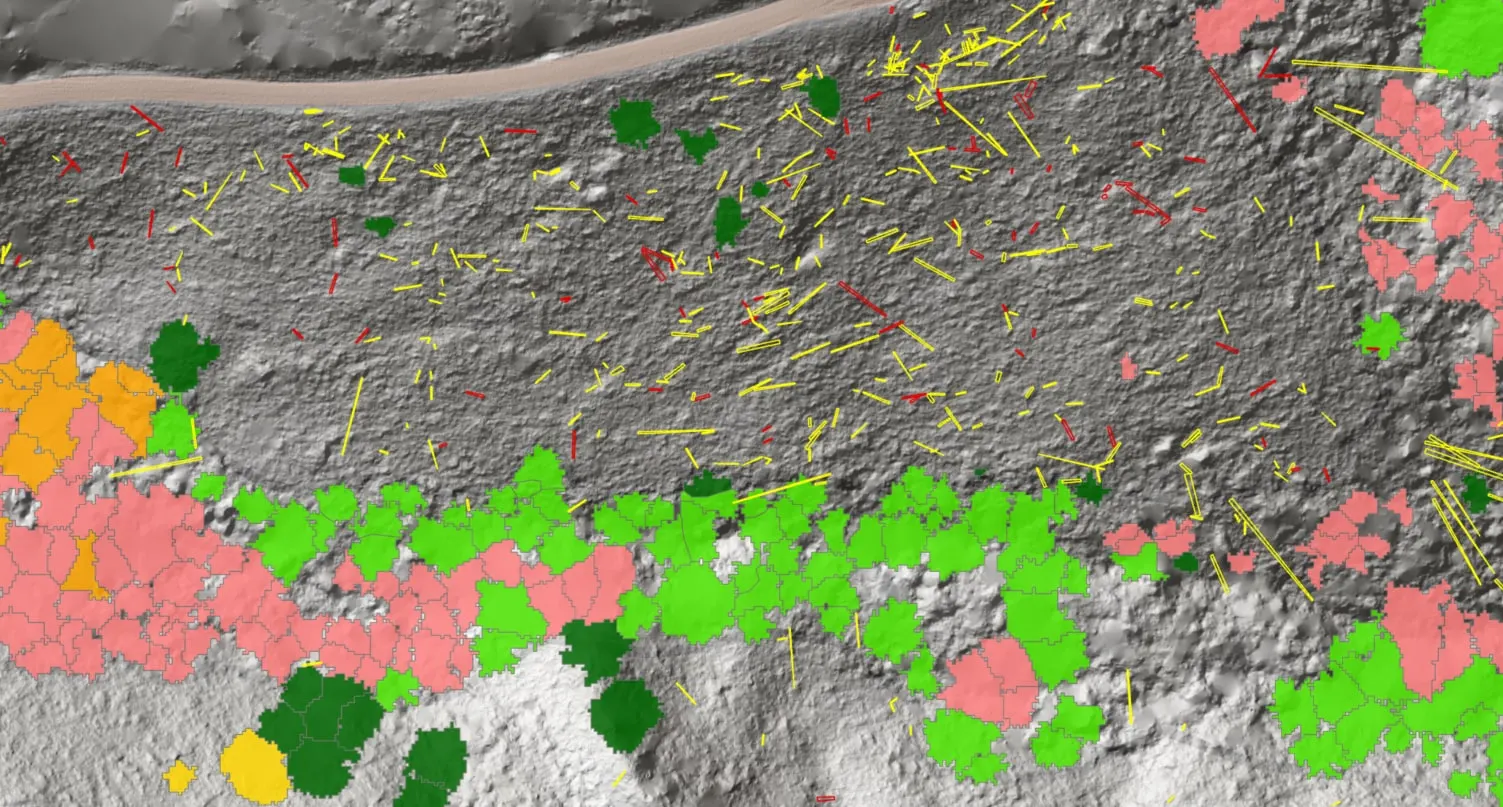
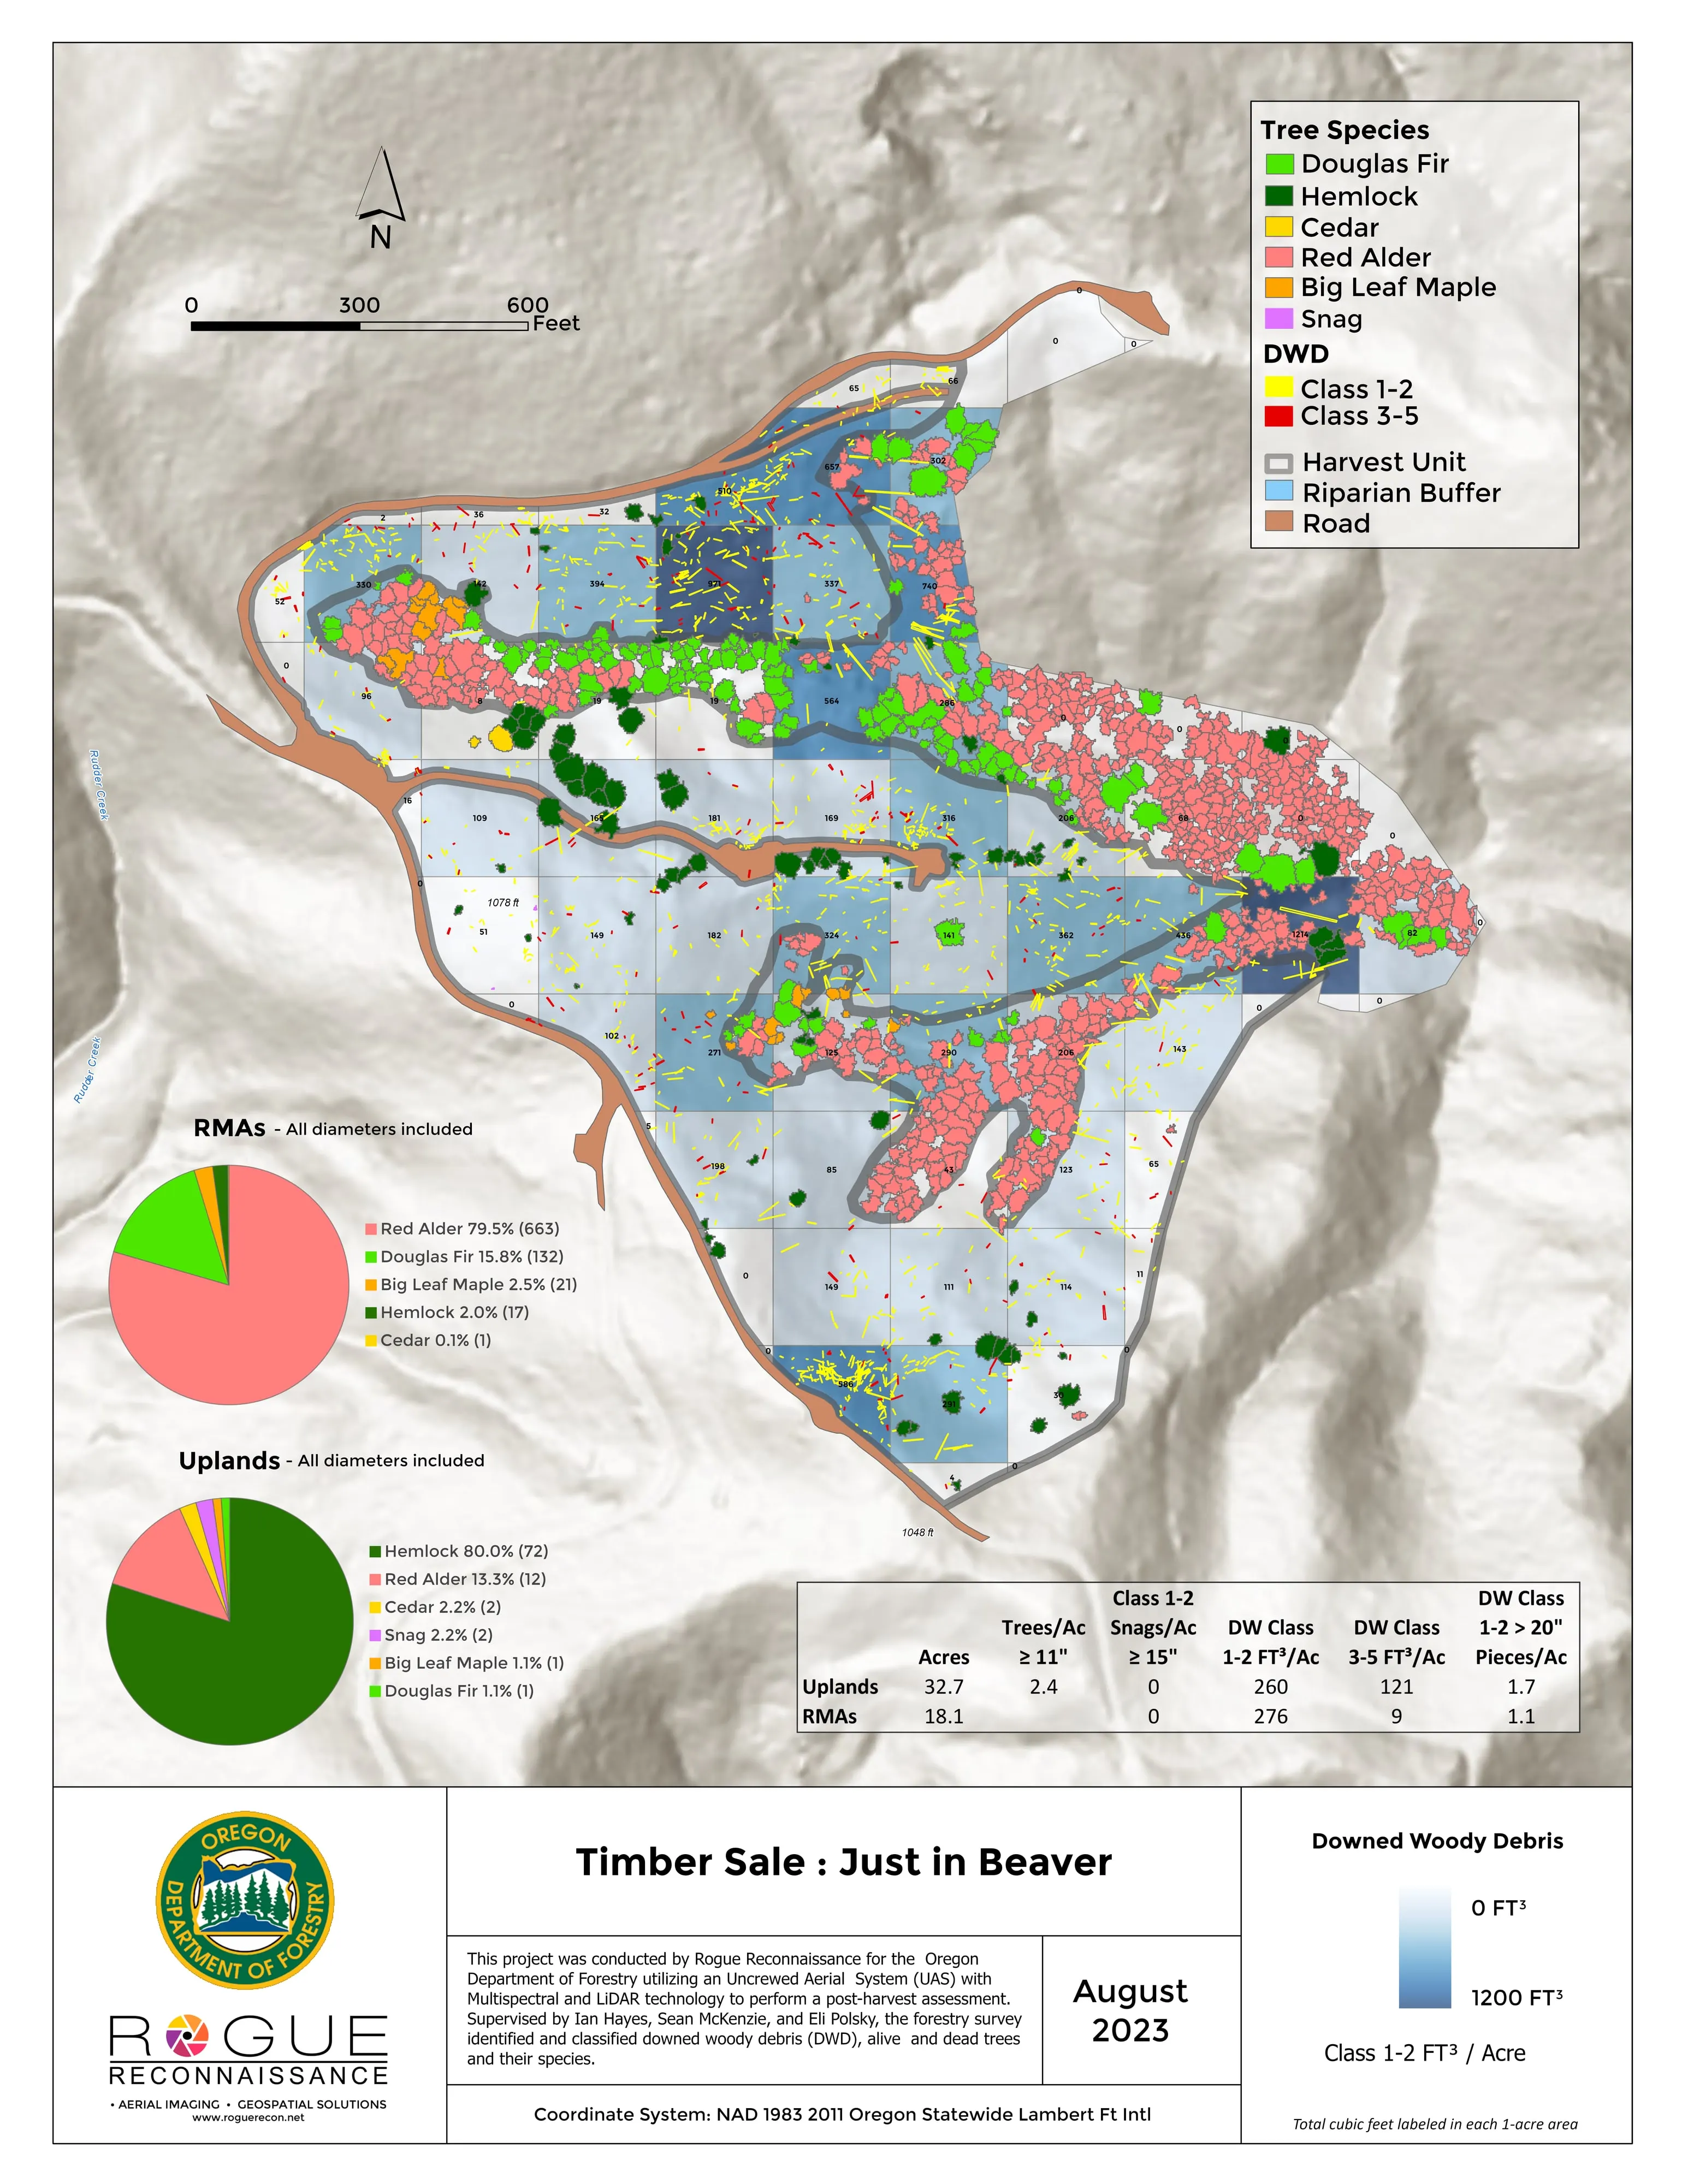
Every log on the unit, counted and measured
Post harvest and fuels compliance from the air instead of transects. Counts, size and decay classes, volume per acre, and the standing trees to species, in a package the Oregon Department of Forestry can file.
Species identification and riparian mapping
Which tree is which, across hundreds of acres
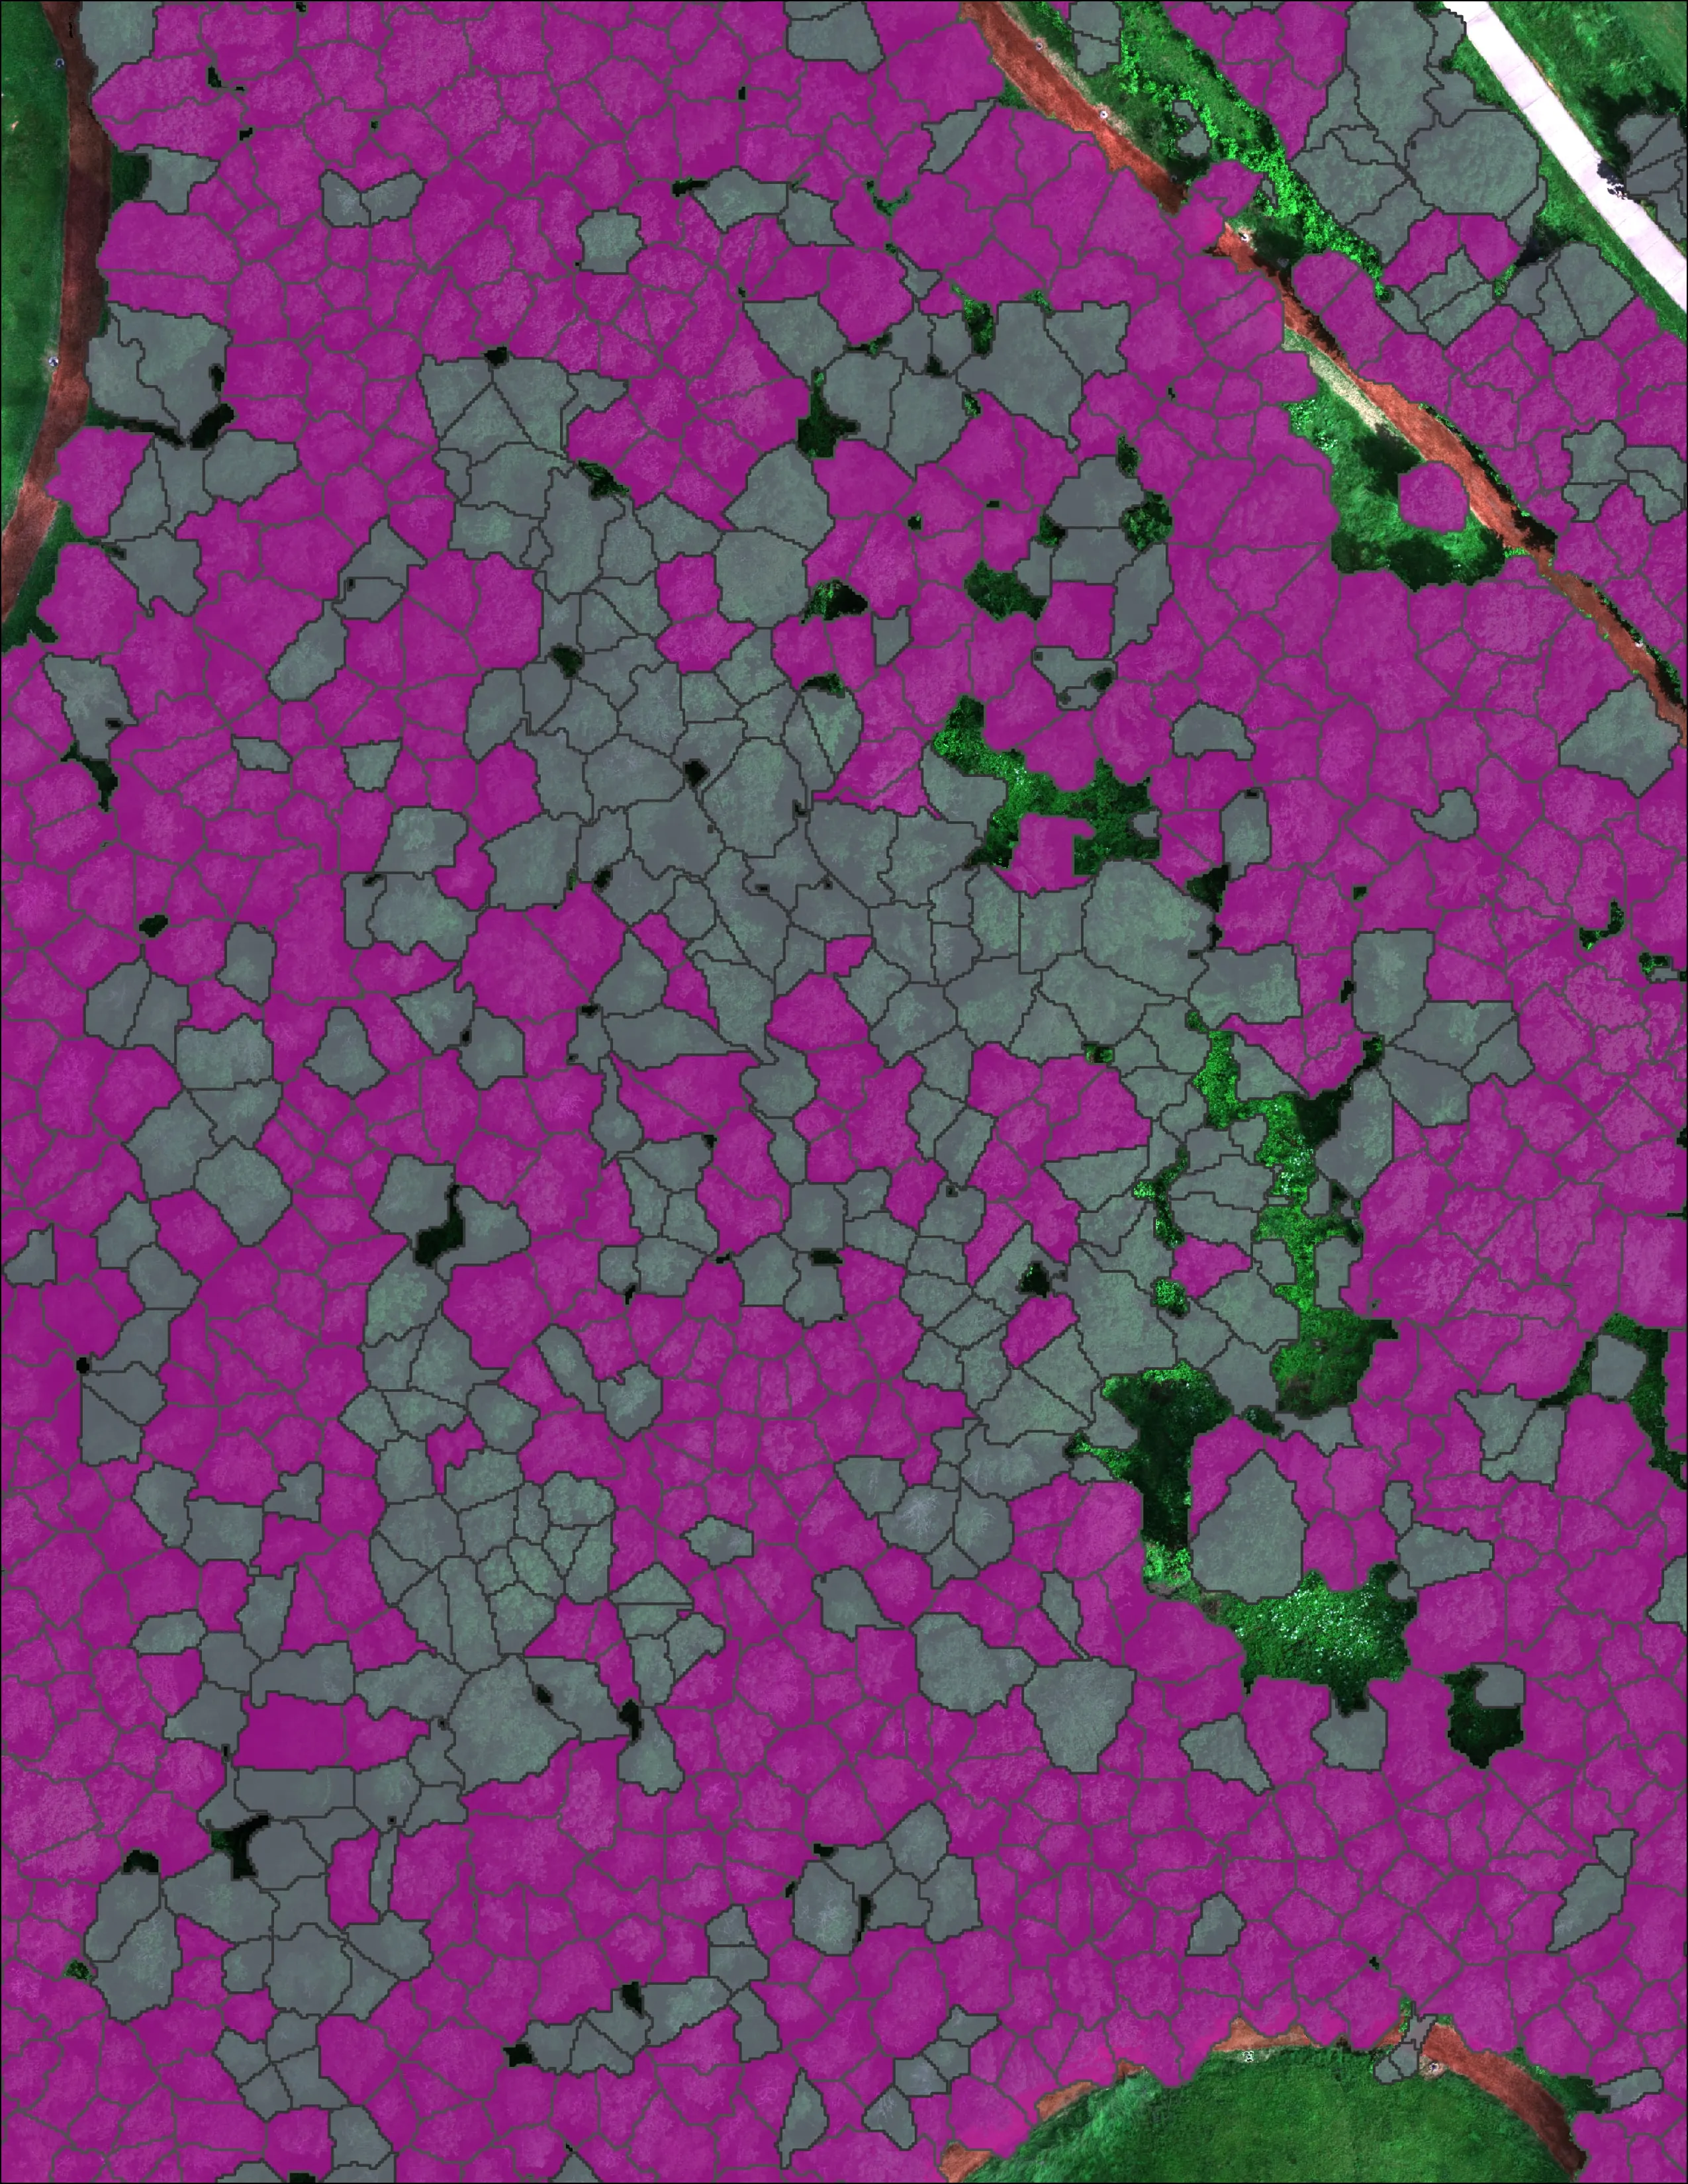
For the City of Eugene we classified 12,632 crowns across 390 acres of riparian corridor and identified 5,261 of them as Oregon ash ahead of emerald ash borer. Willow, maple, and conifers were in the training set on purpose, because a model that has never seen a willow will call it ash.
Fall senescence flights roughly doubled ash detection, so any ash project gets a fall flight. Along the Scott River in the Klamath Basin we took the same approach to fourteen riparian species, with a botanist reviewing the calls.
The Eugene ash inventory Riparian species on the Scott River
At risk, declining, dieback, dead
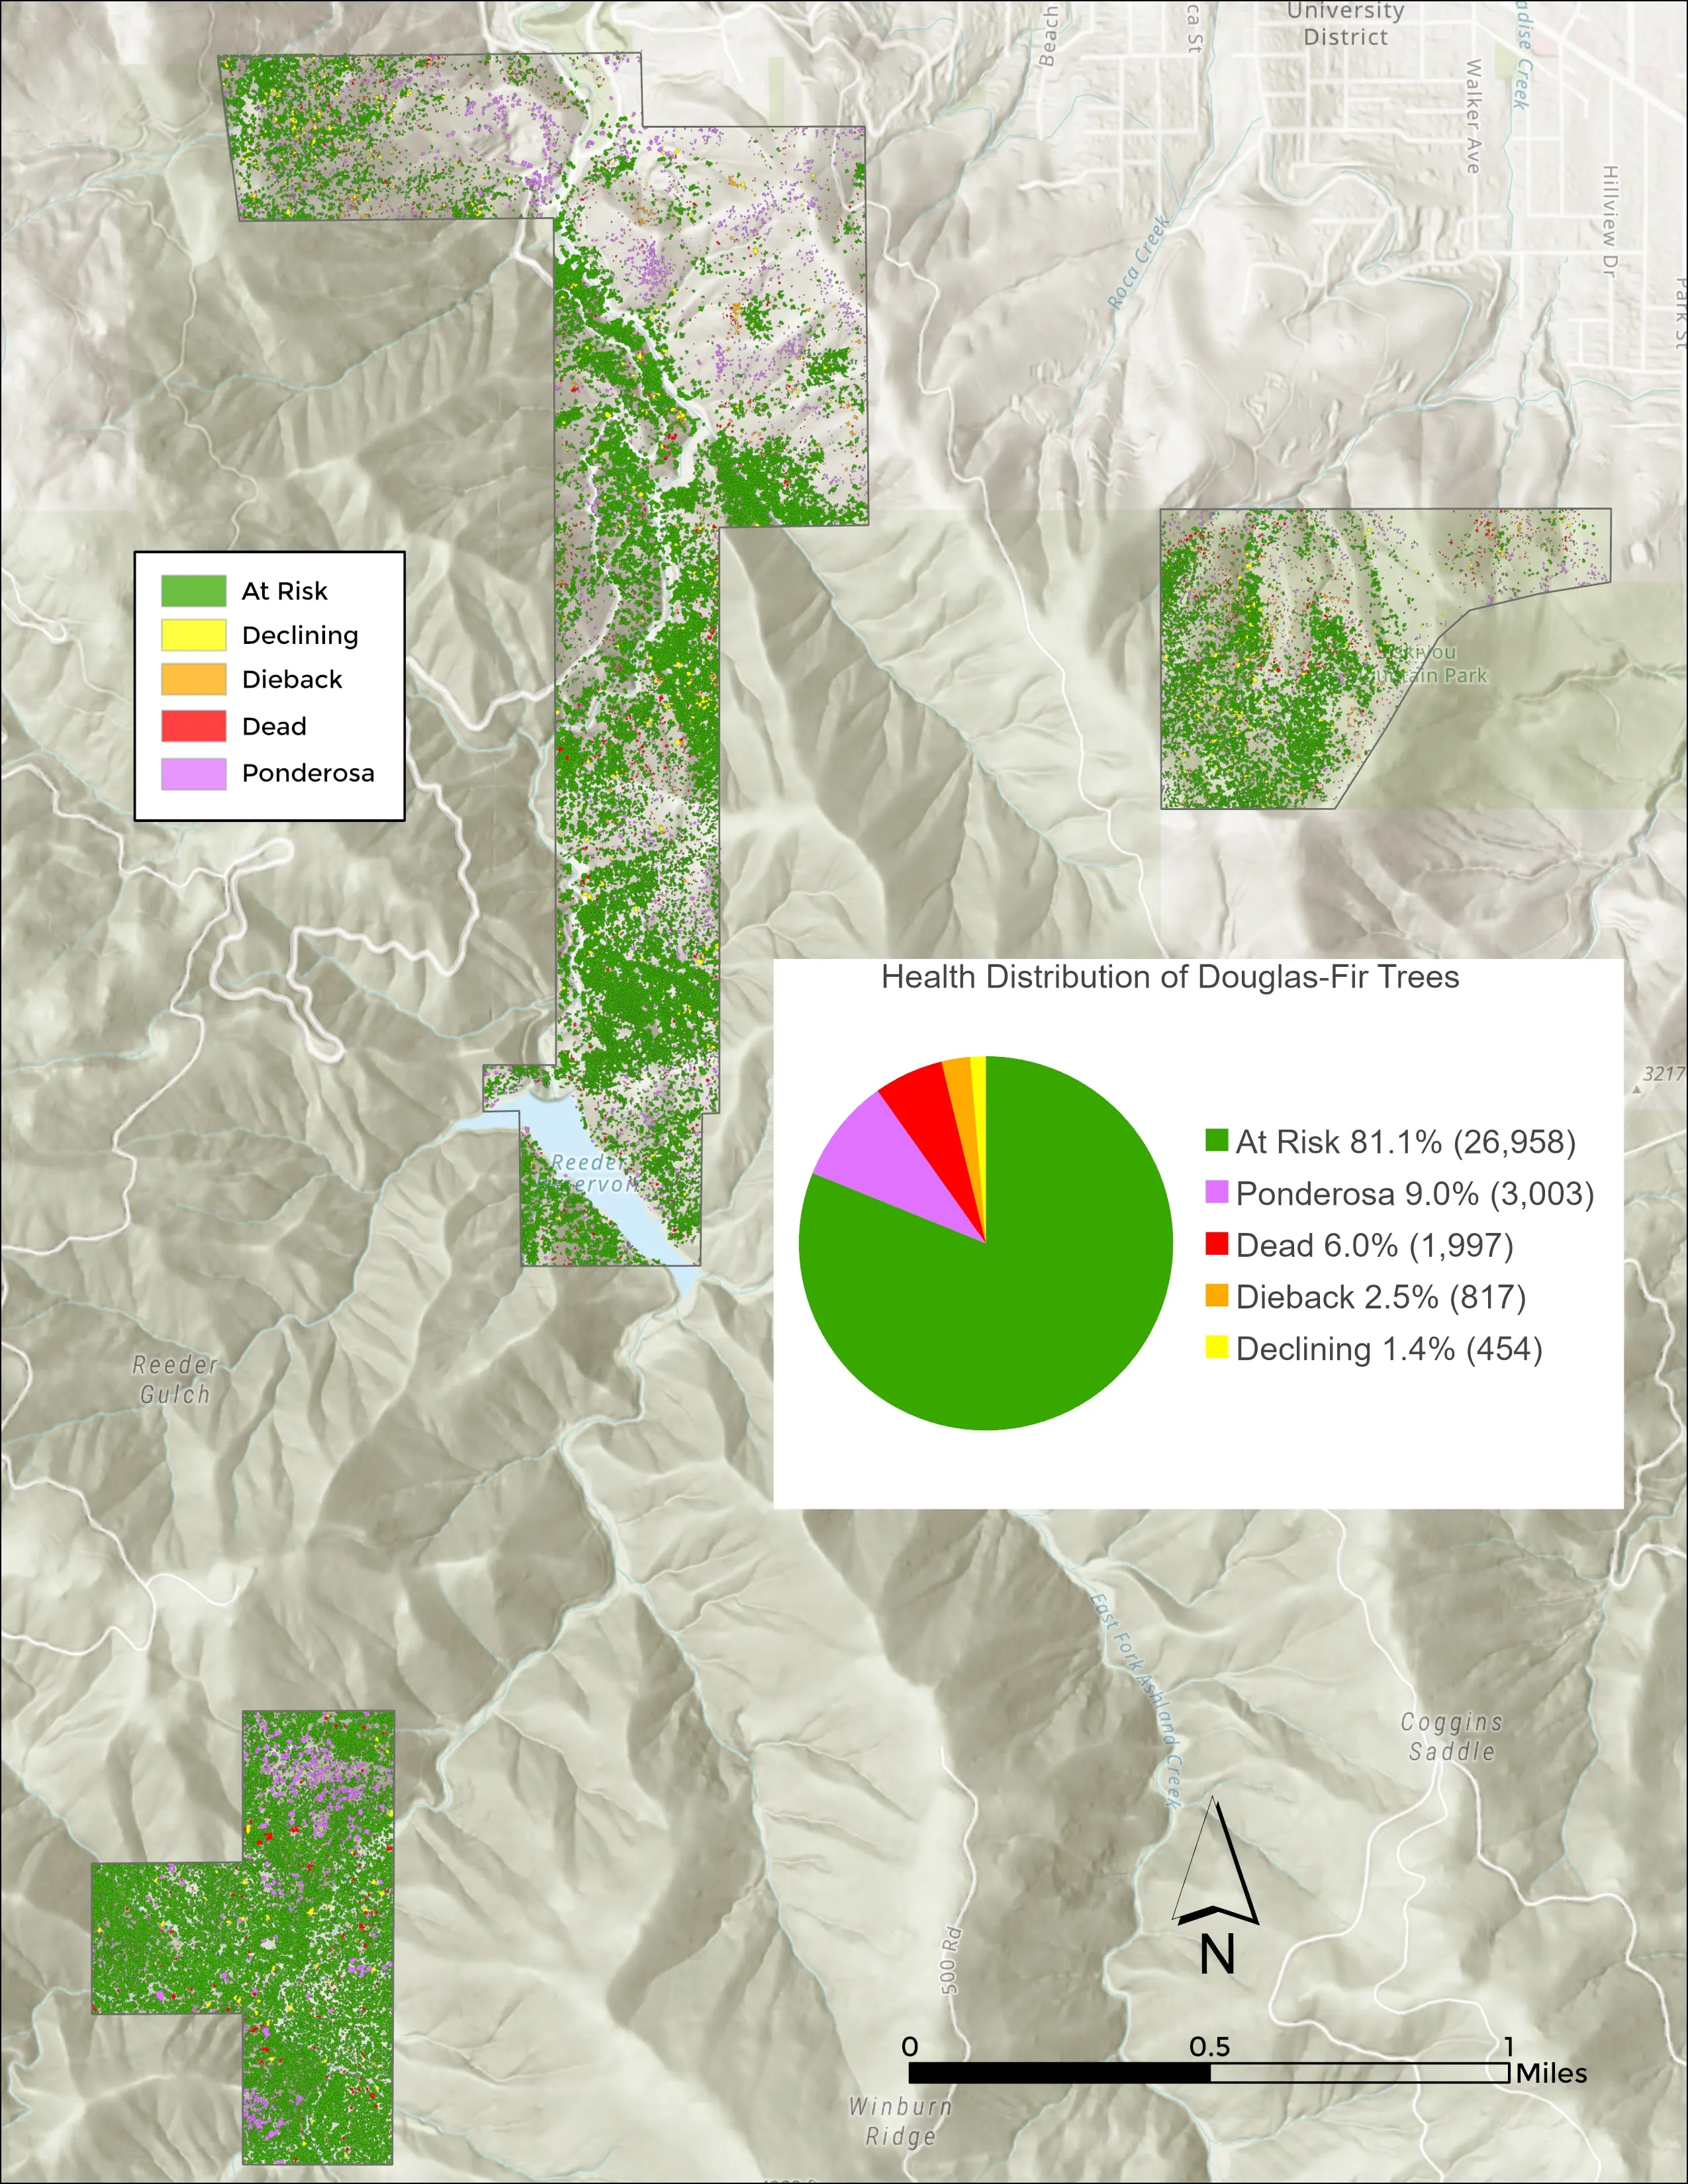
A count of what is dying, tree by tree
For the City of Ashland we classed about 30,000 Douglas fir crowns across city owned watershed lands into four health classes, with a map and a tally per area. The city published the 2023 findings and Ashland News covered them; the 2024 count is what stood after the city's removal work.
CWPP support
Fuels mapping the plan can point to
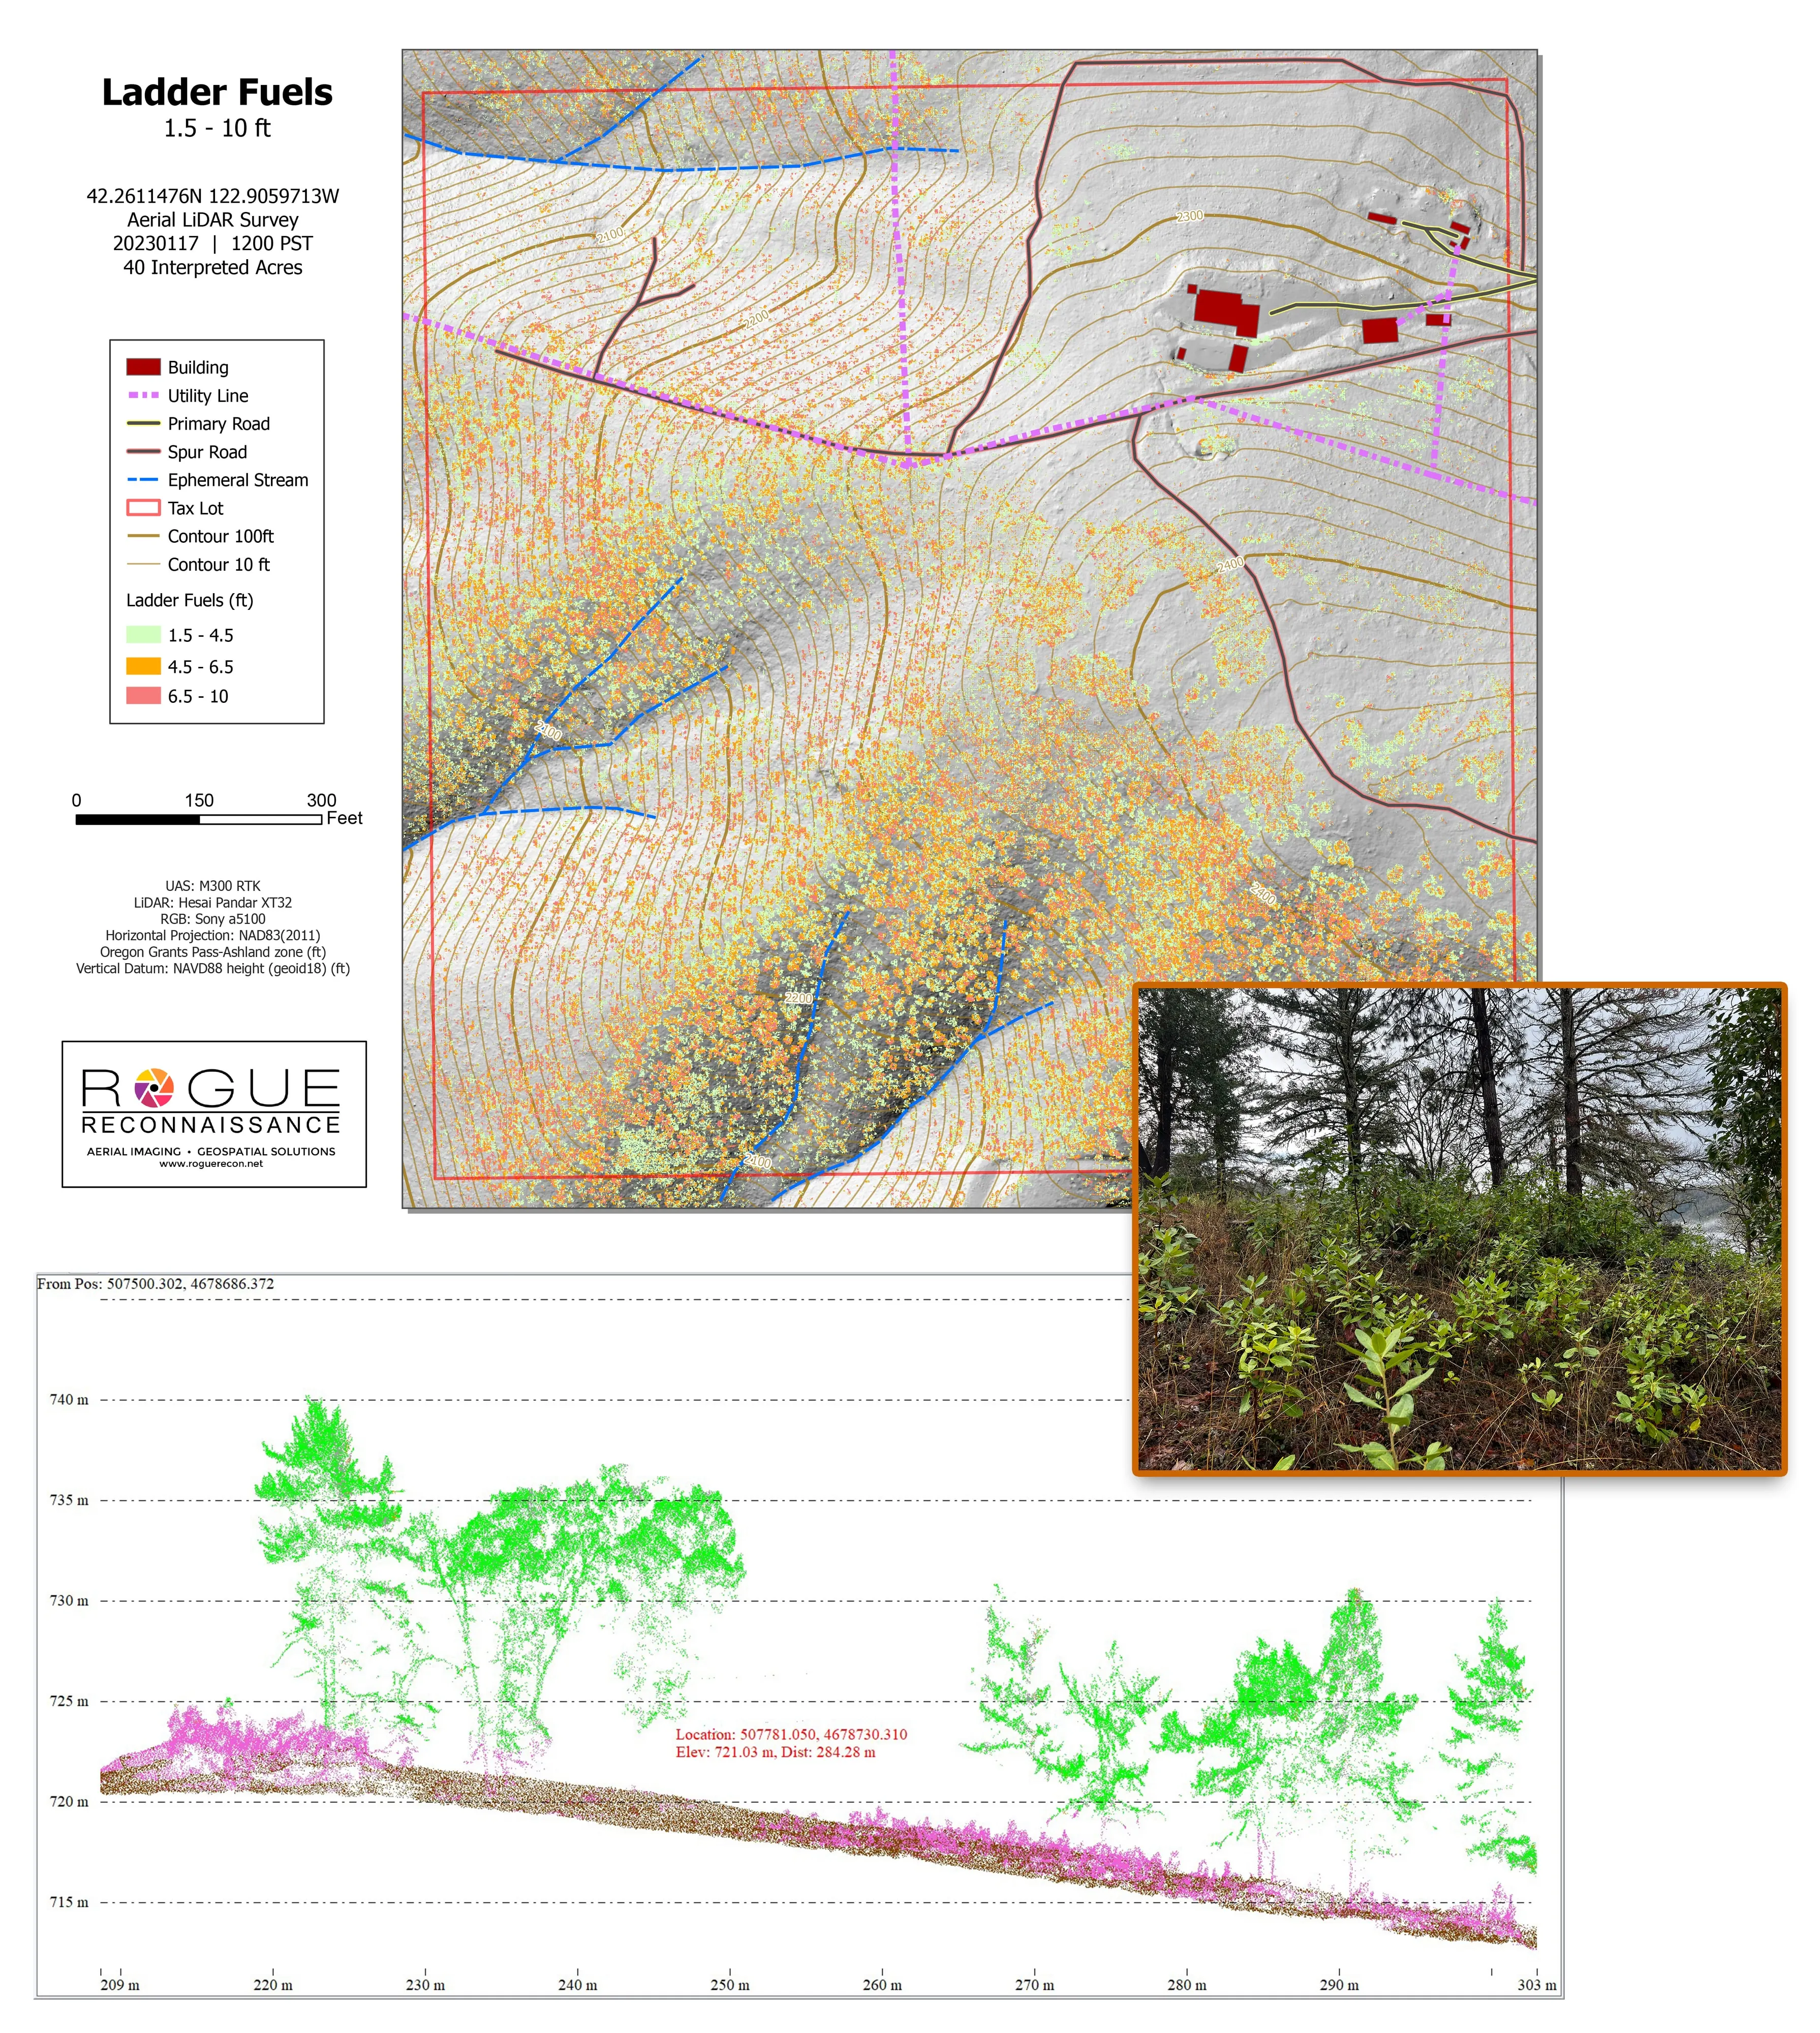
Canopy height, ladder fuel identification, and structure exposure: how much ladder fuel sits around each structure, what is growing within five feet of it, and how much canopy hangs over the roof. Citywide drone LiDAR gave the 2025 Ashland Community Wildfire Protection Plan those numbers, parcel by parcel, delivered into the city's own GIS.
A classified point cloud separates ground, low, medium, and high vegetation. That separation is what makes a ladder fuel call possible.
Post harvest monitoring
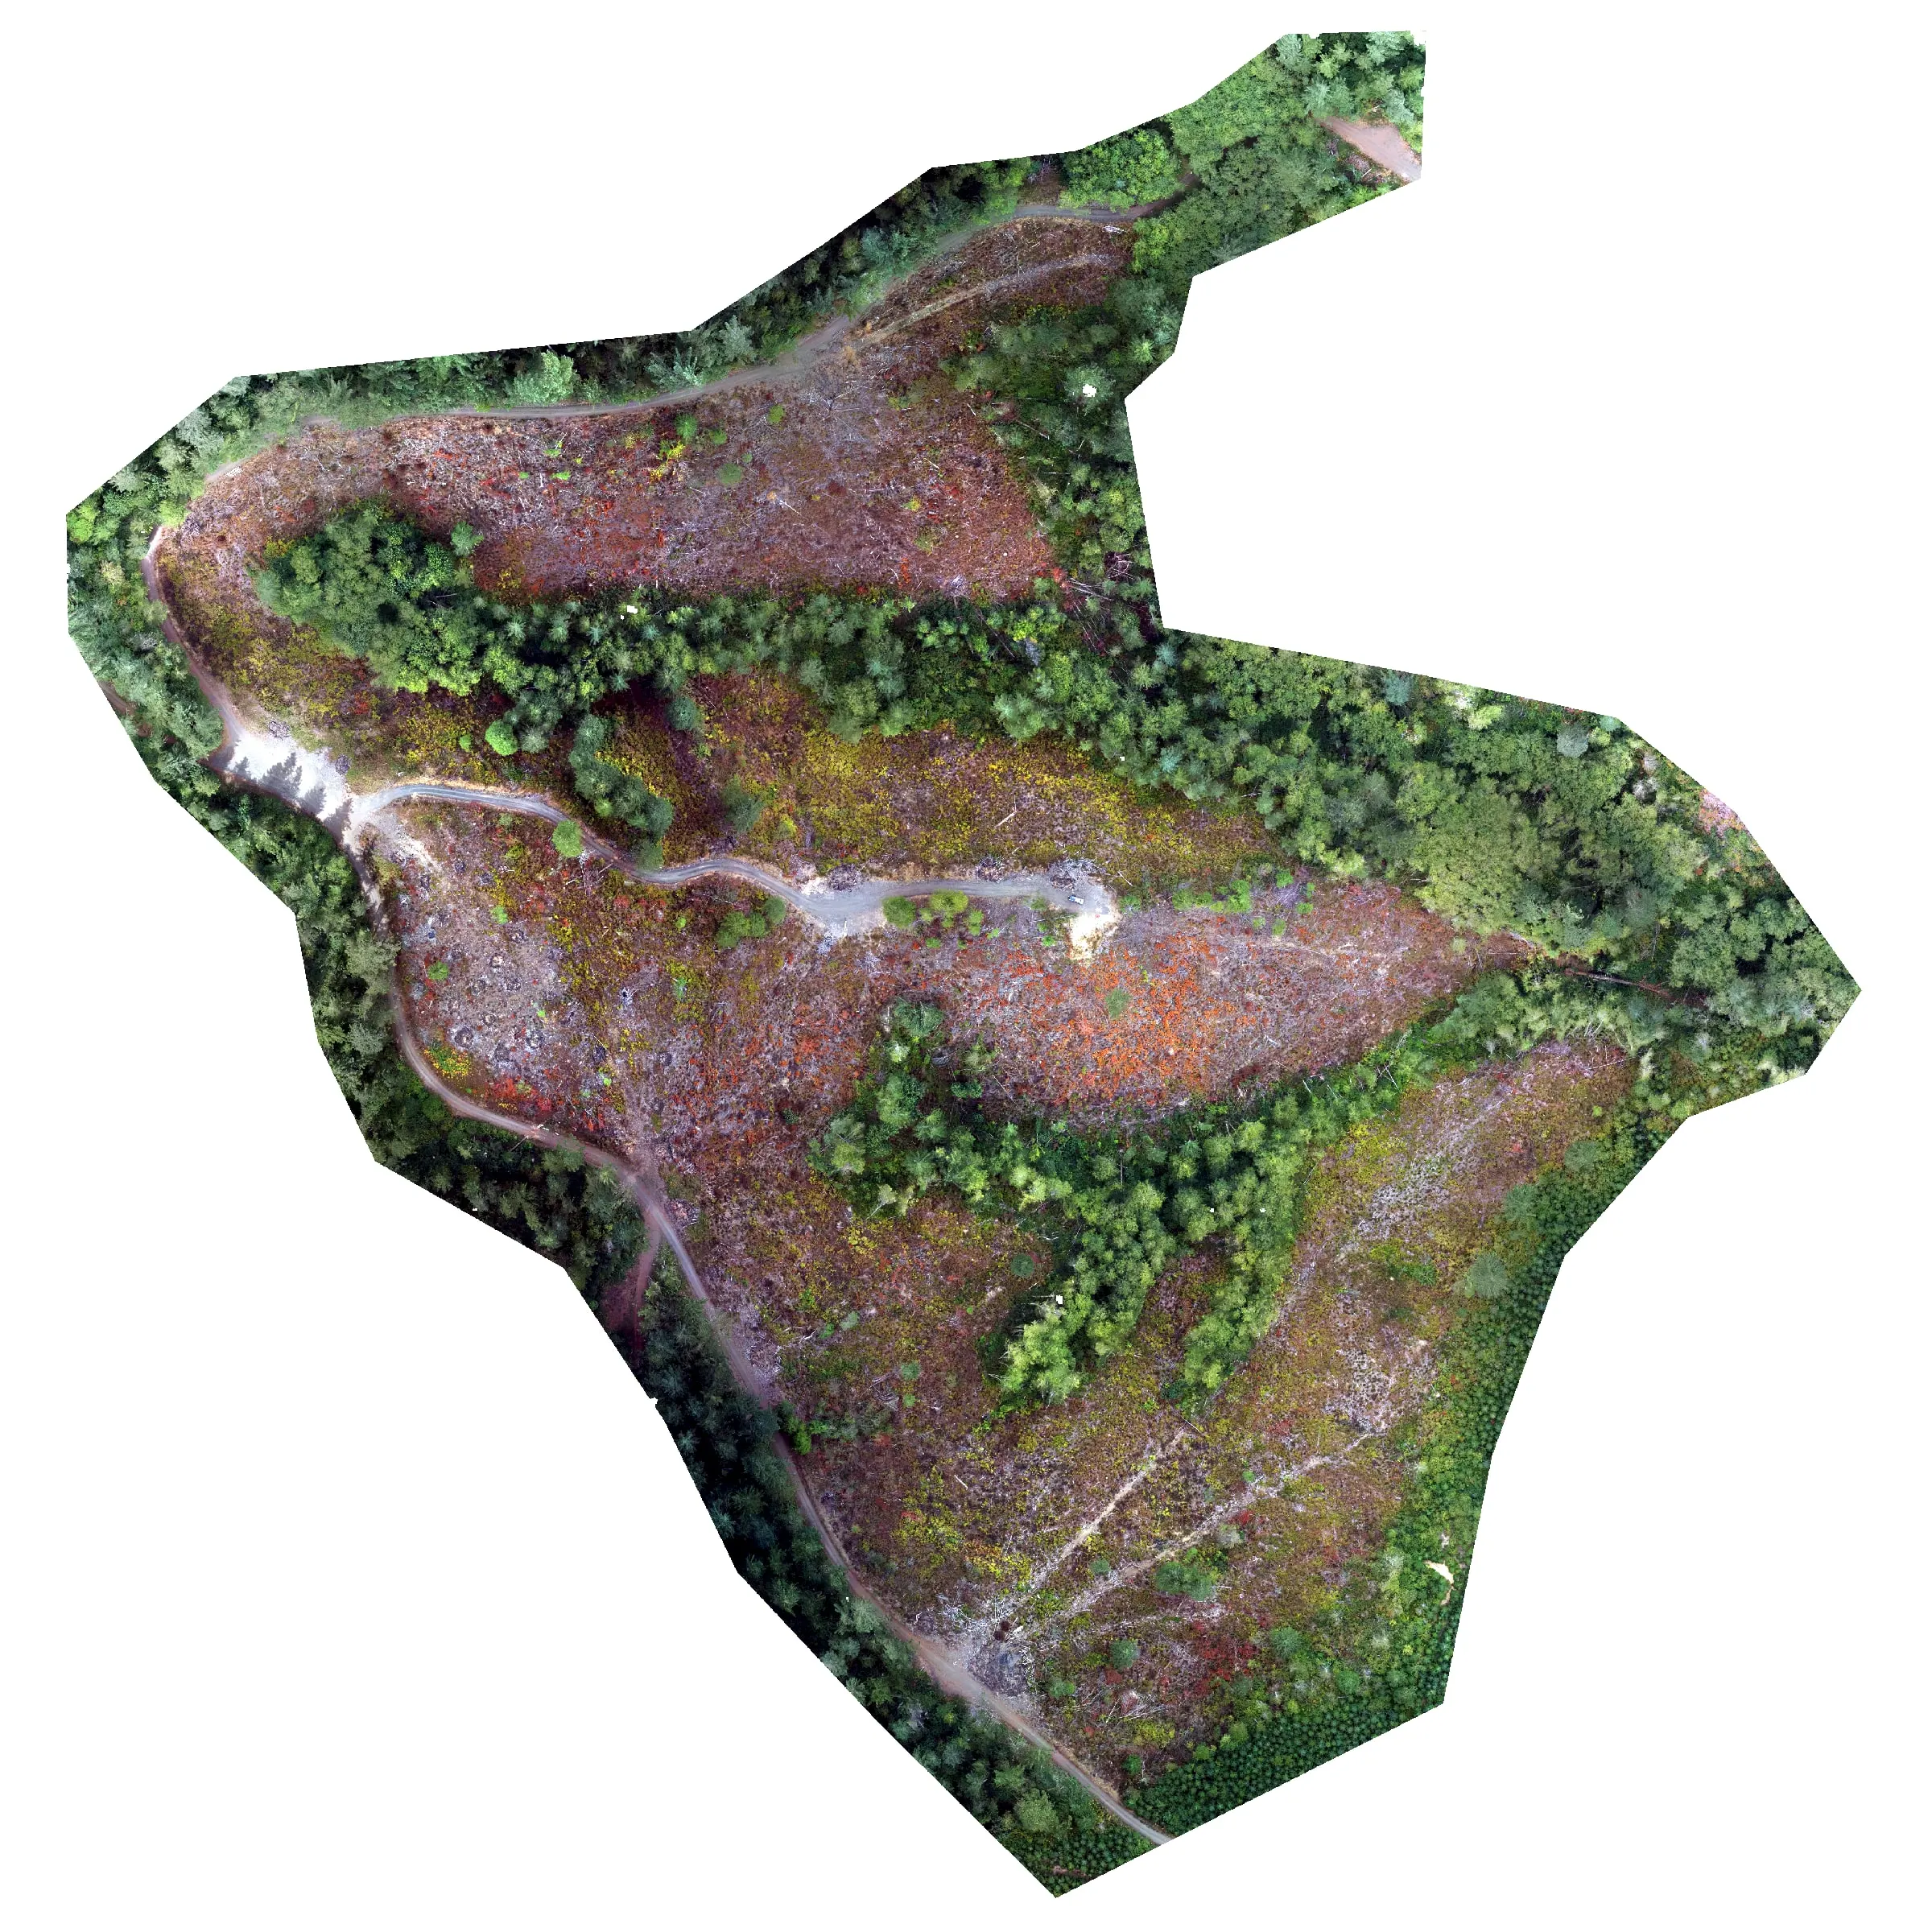
LiDAR, multispectral, and RGB over the unit
The Oregon Department of Forestry unit behind the debris case. The video shows the products, the StoryMap walks the method.

How we validate
How we check the number
Every classification is trained on crowns a person checked on the ground and validated on points the model never saw. The Eugene ash model adds leakage free repeated cross validation. We report overall accuracy with sensitivity and specificity, publish the confusion matrix, and say which classes are weak. On the Eugene ash inventory that came out at 82 percent overall accuracy, 77 percent ash sensitivity, and 84 percent specificity on more than 300 ground truth crowns.
Every classification job ships a written report with the data, so the forester can read the method and the accuracy table without opening GIS.
Deliverables
- Classified crowns
- Canopy height model
- Species maps
- Health classes
- DWD counts and maps
- Orthomosaics
- LiDAR terrain
- StoryMaps and dashboards
Related work
From the field
Downed woody debris, measured from the air
Oregon Department of Forestry
Every log on a post harvest unit delineated, measured, and classed by decay, with standing trees identified to species.
Read the case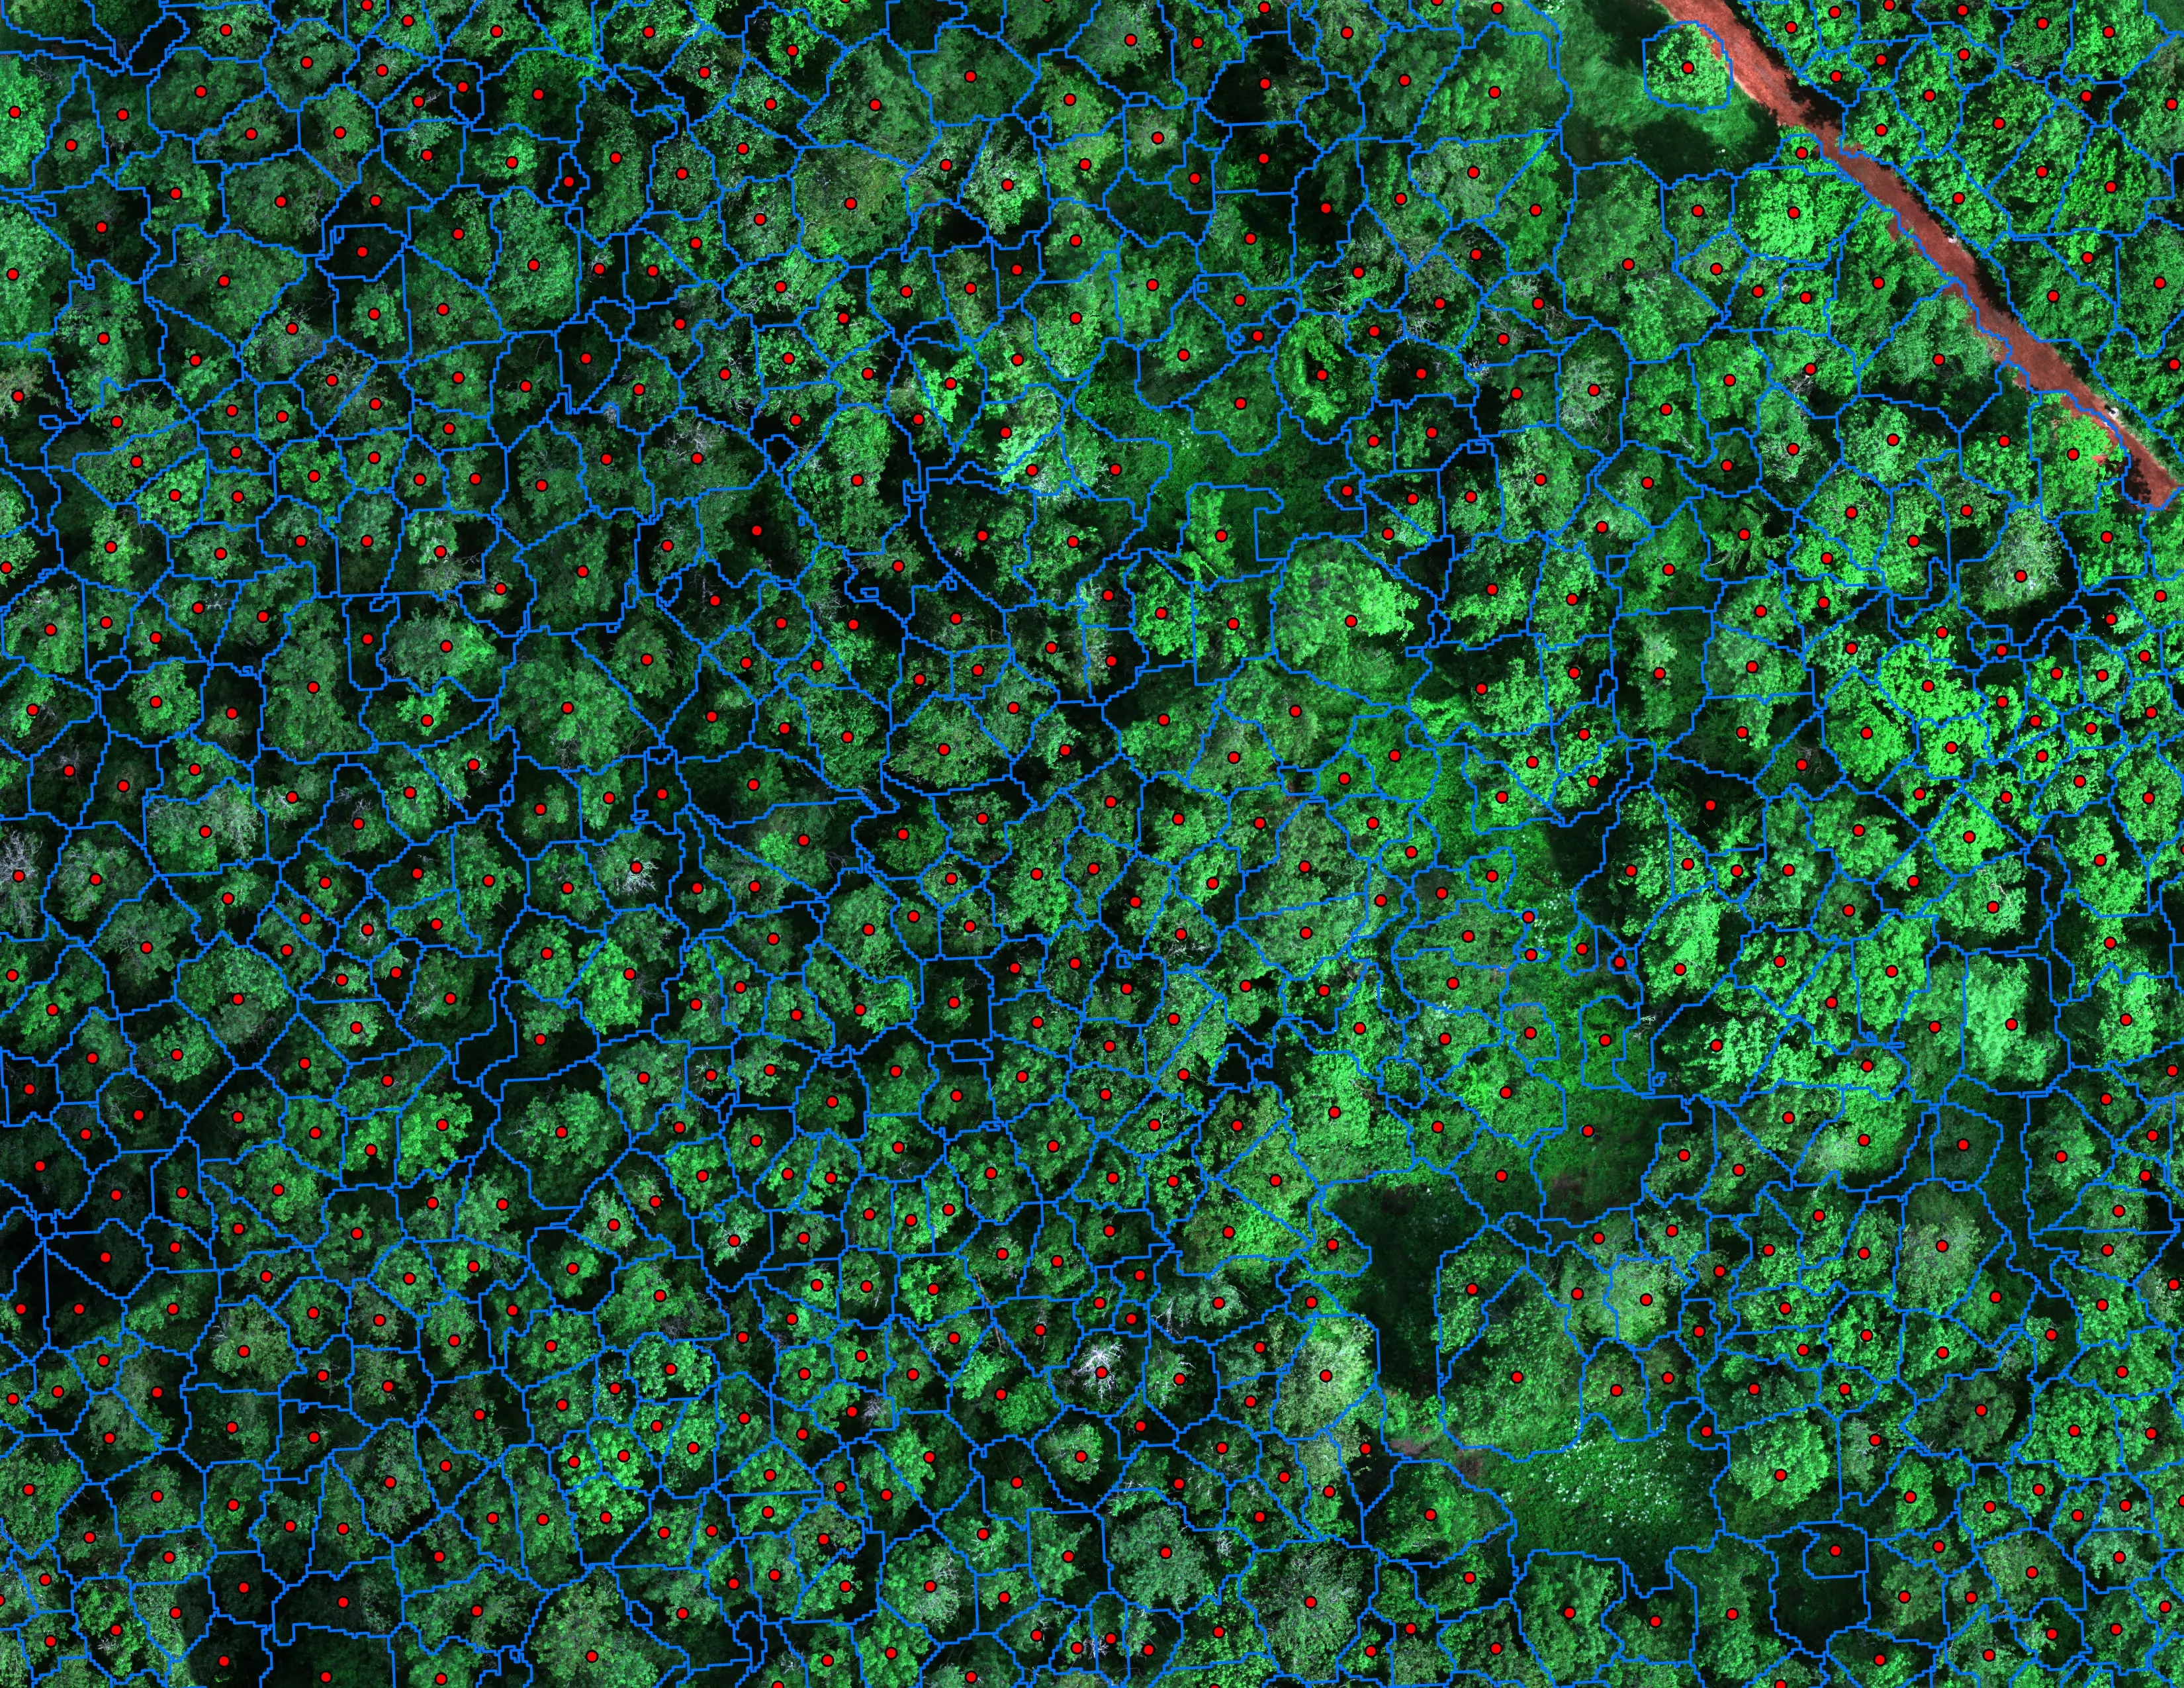
Finding every Oregon ash before the borer does
City of Eugene, Parks and Open Space
12,632 crowns classified across 390 acres of riparian canopy. 5,261 of them Oregon ash.
Read the case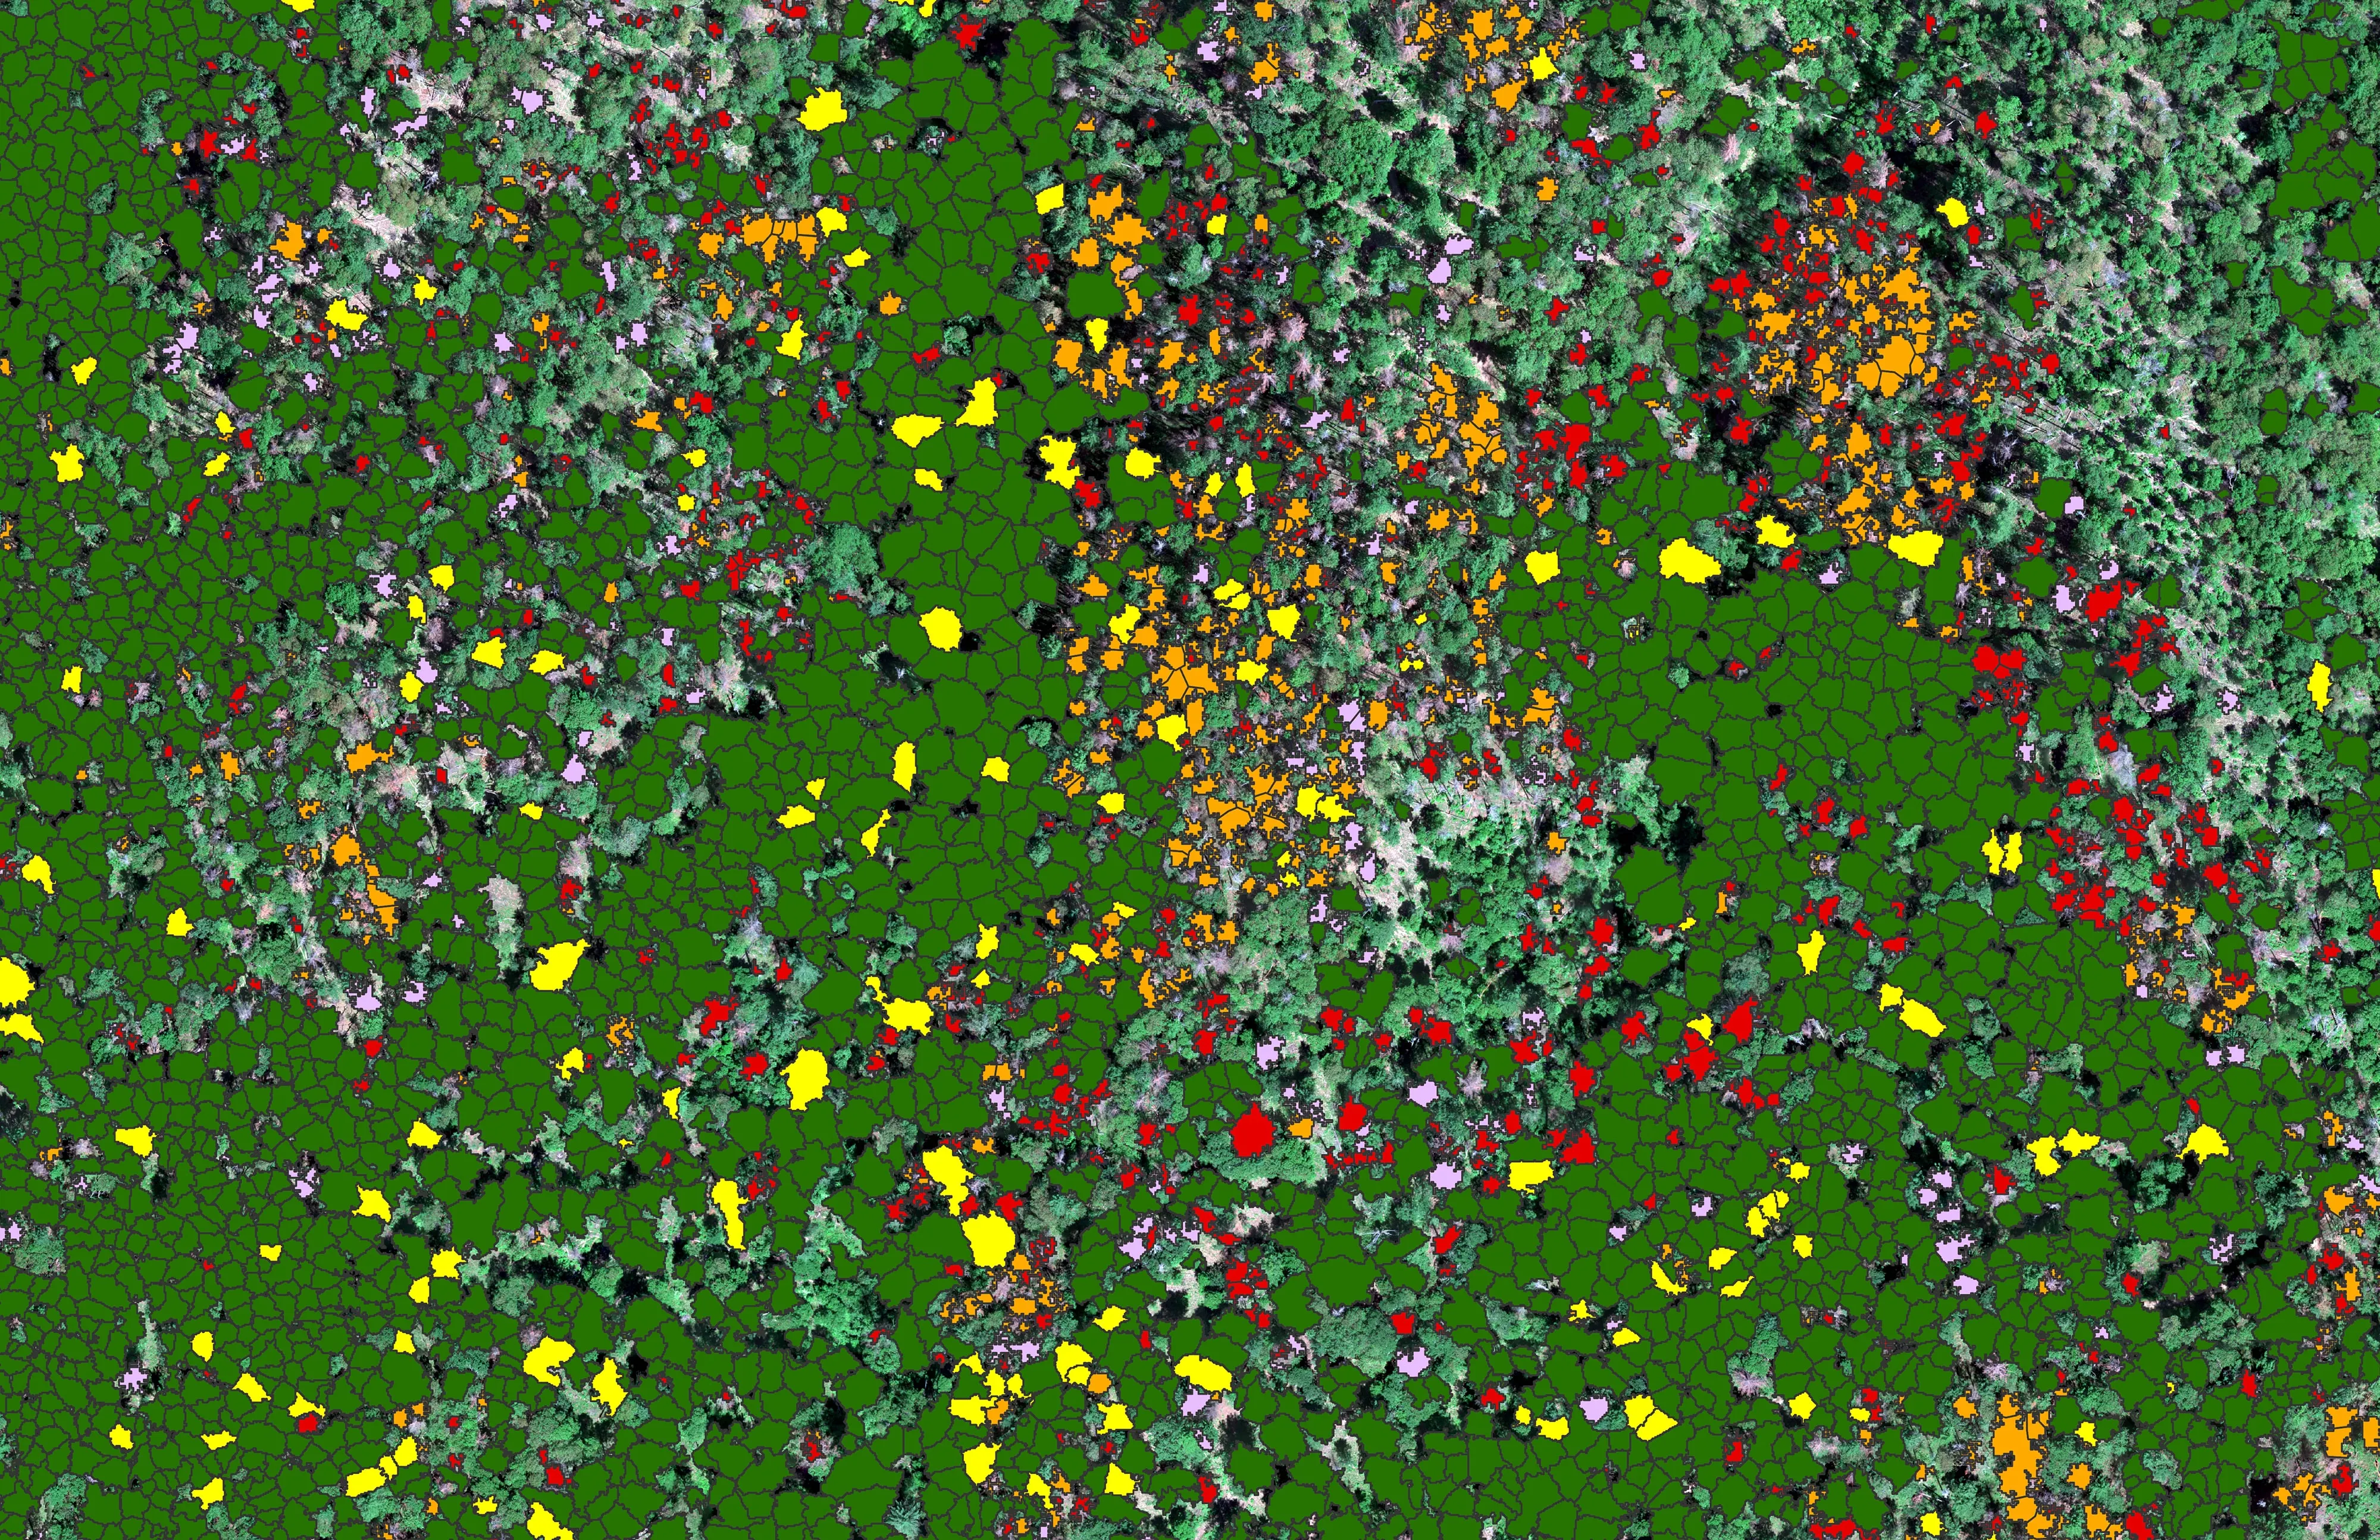
At risk, declining, dieback, dead
City of Ashland
About 30,000 Douglas fir crowns classed by health across the city's watershed lands, so the city could see the die off and act on it.
Read the caseThe sensors and methods behind this lane:
Let's talk about your stand.
Email info@roguerecon.net or call 541 708 2151.