
The problem
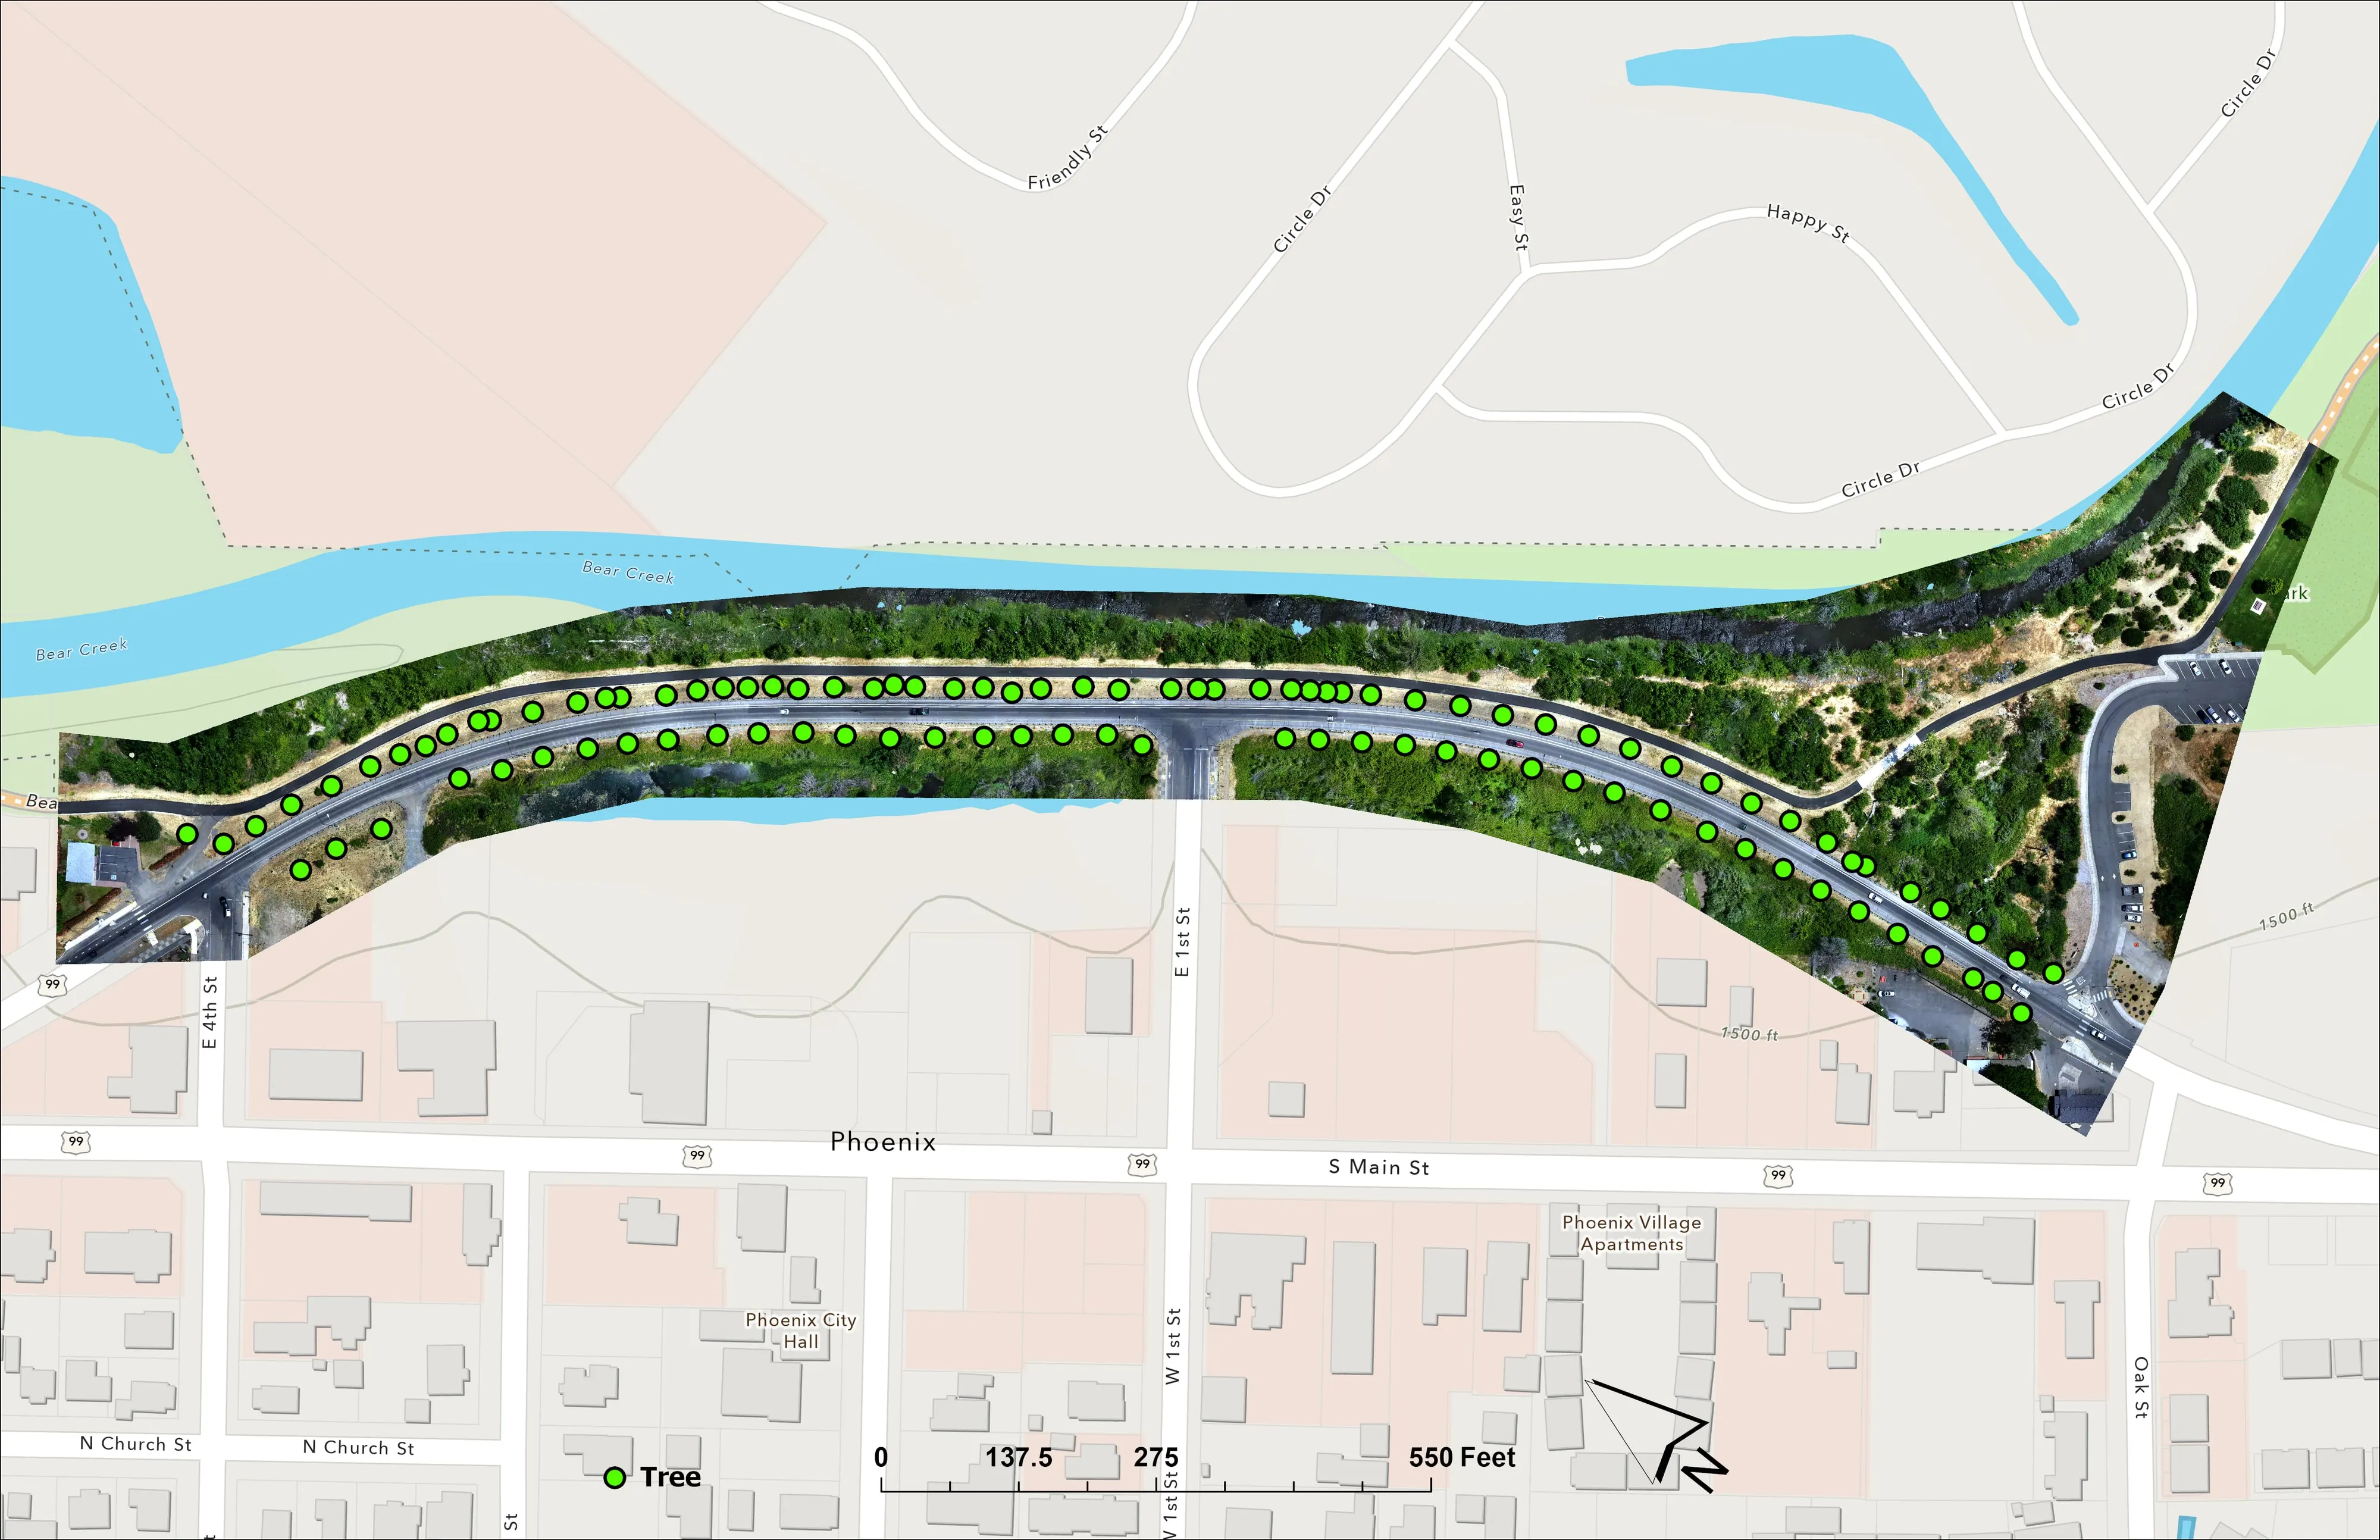
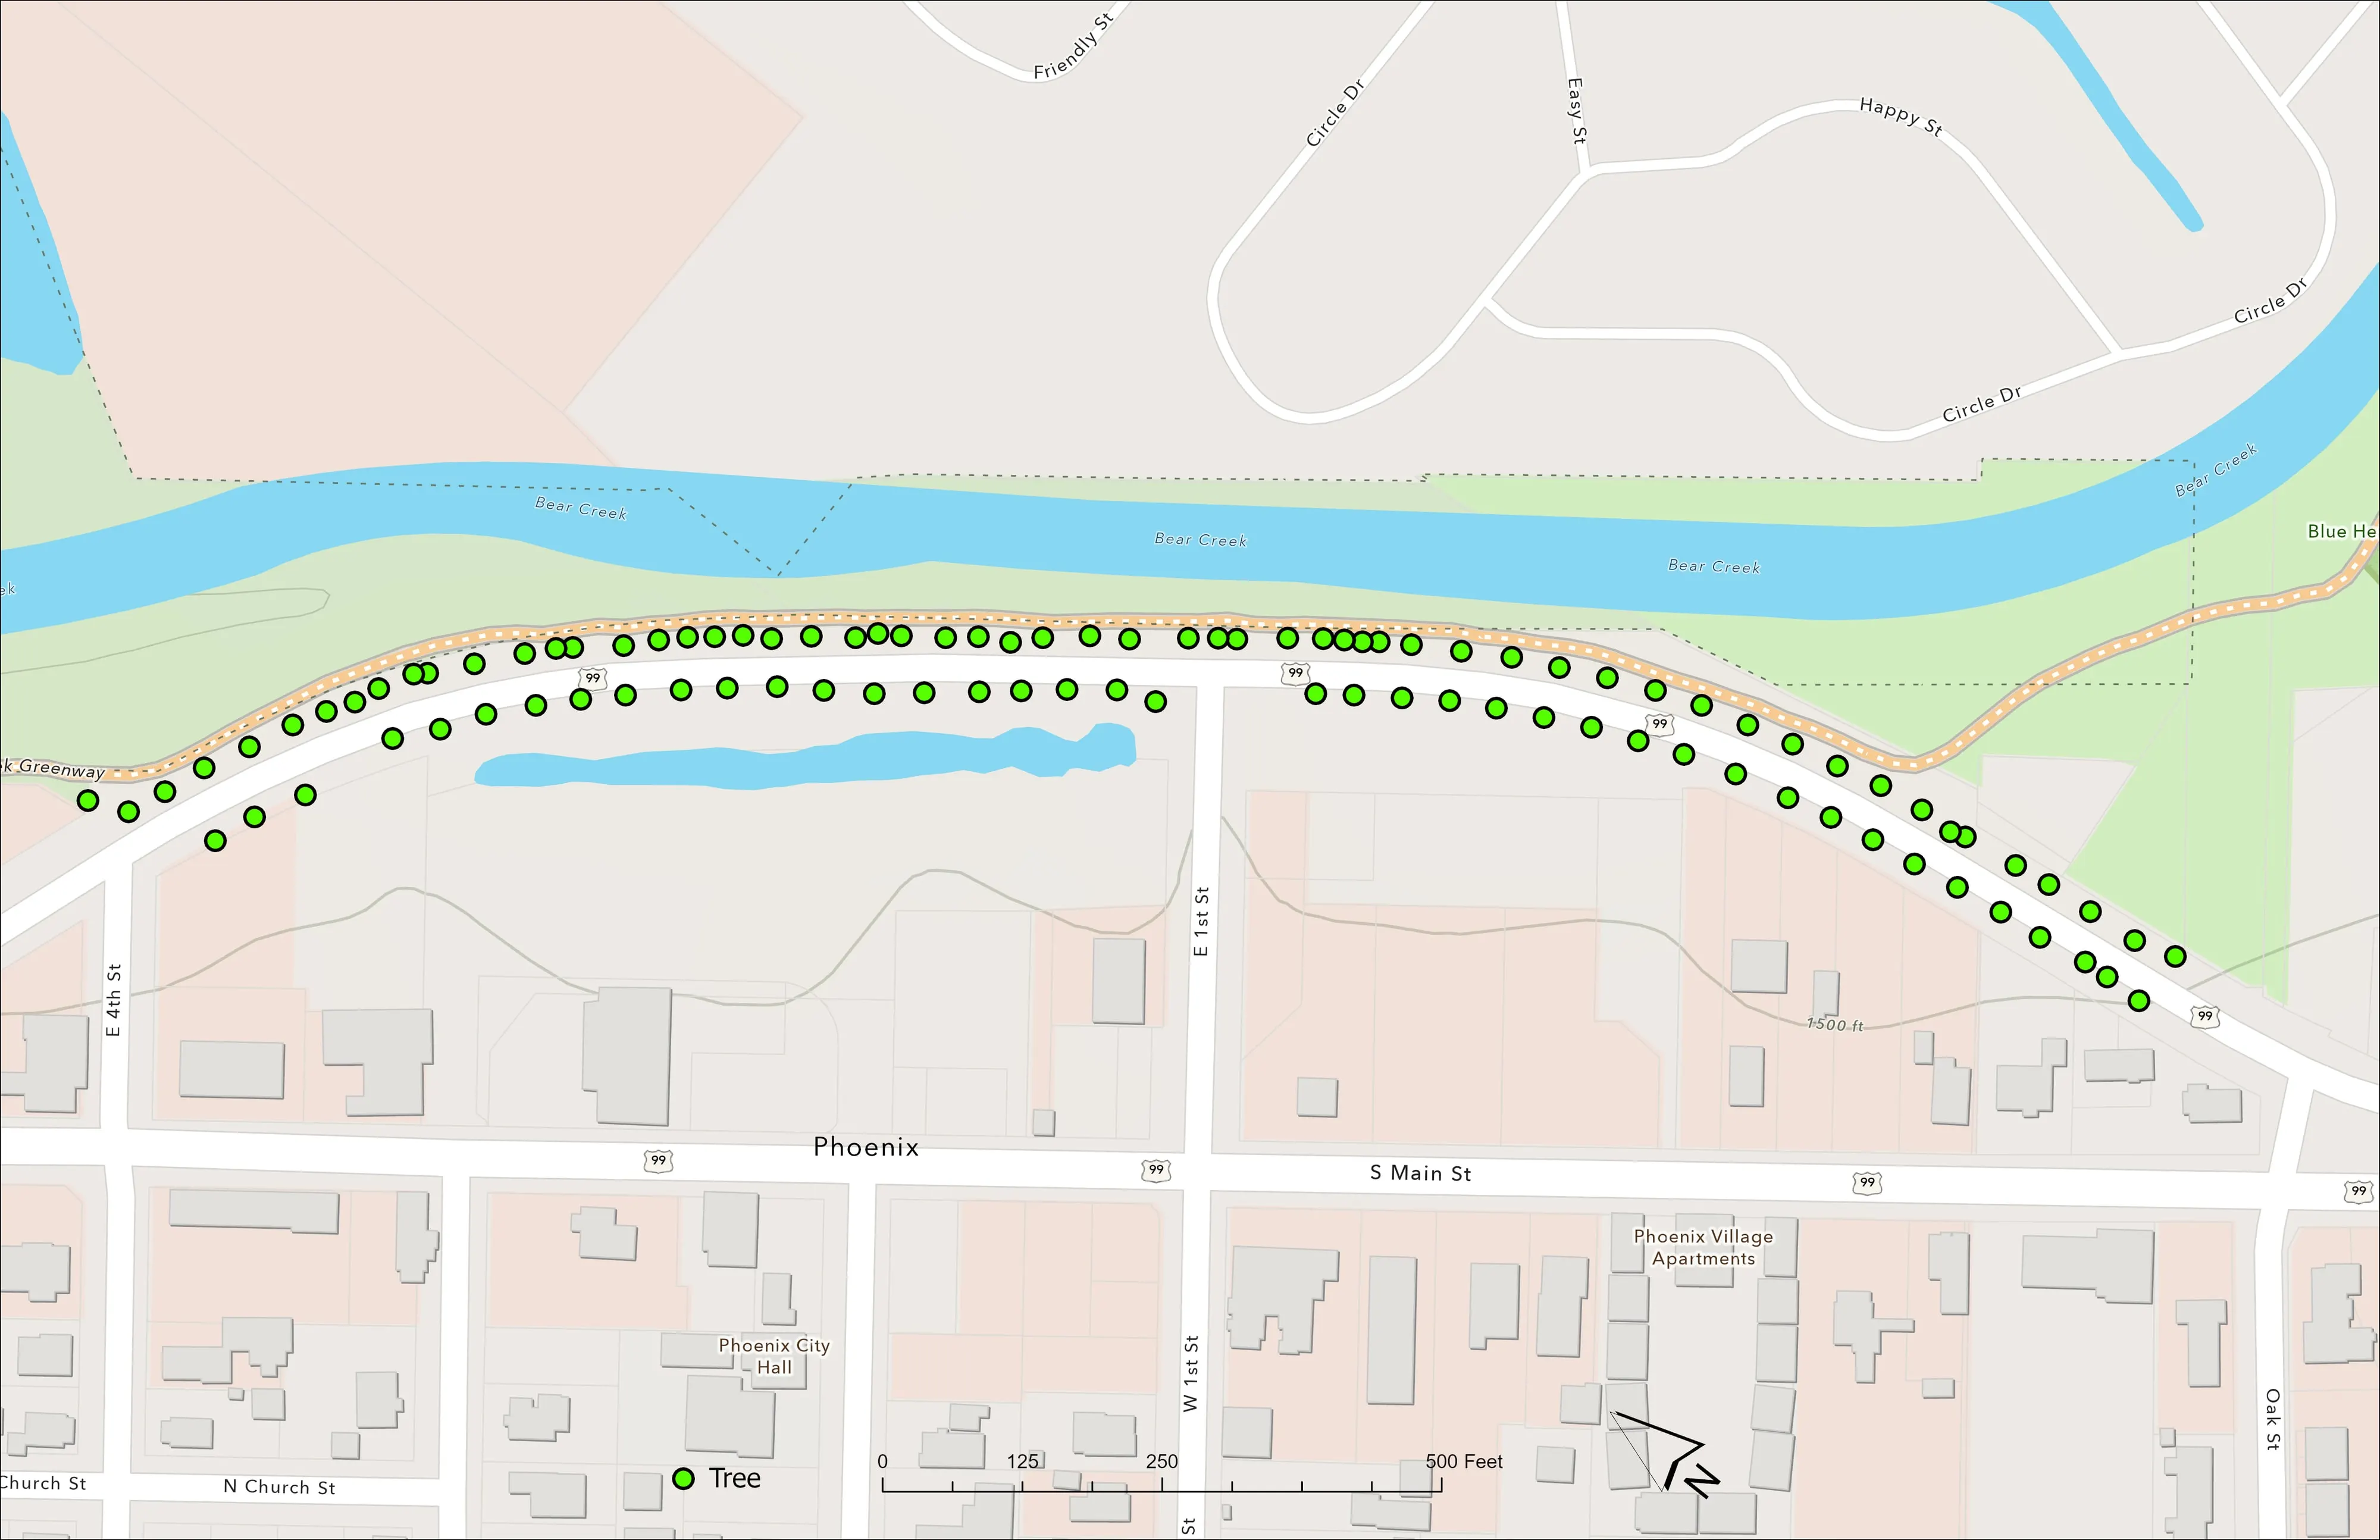
The city planted 98 trees on April 12, 2025 along a corridor the Almeda fire burned in 2020. A young planting is judged over years, and the record has to start with the ground, the canopy, and where every tree stands in year one.
What we flew
- Drone LiDAR and RGB over the Bear Creek Greenway and Highway 99, June 16, 2025
- The city's field records for 98 trees, planted April 12, 2025 and collected on the ground May 29, 2025
What we delivered
- Classified point cloud as LAS in EPSG 6557, Oregon Statewide Lambert, feet
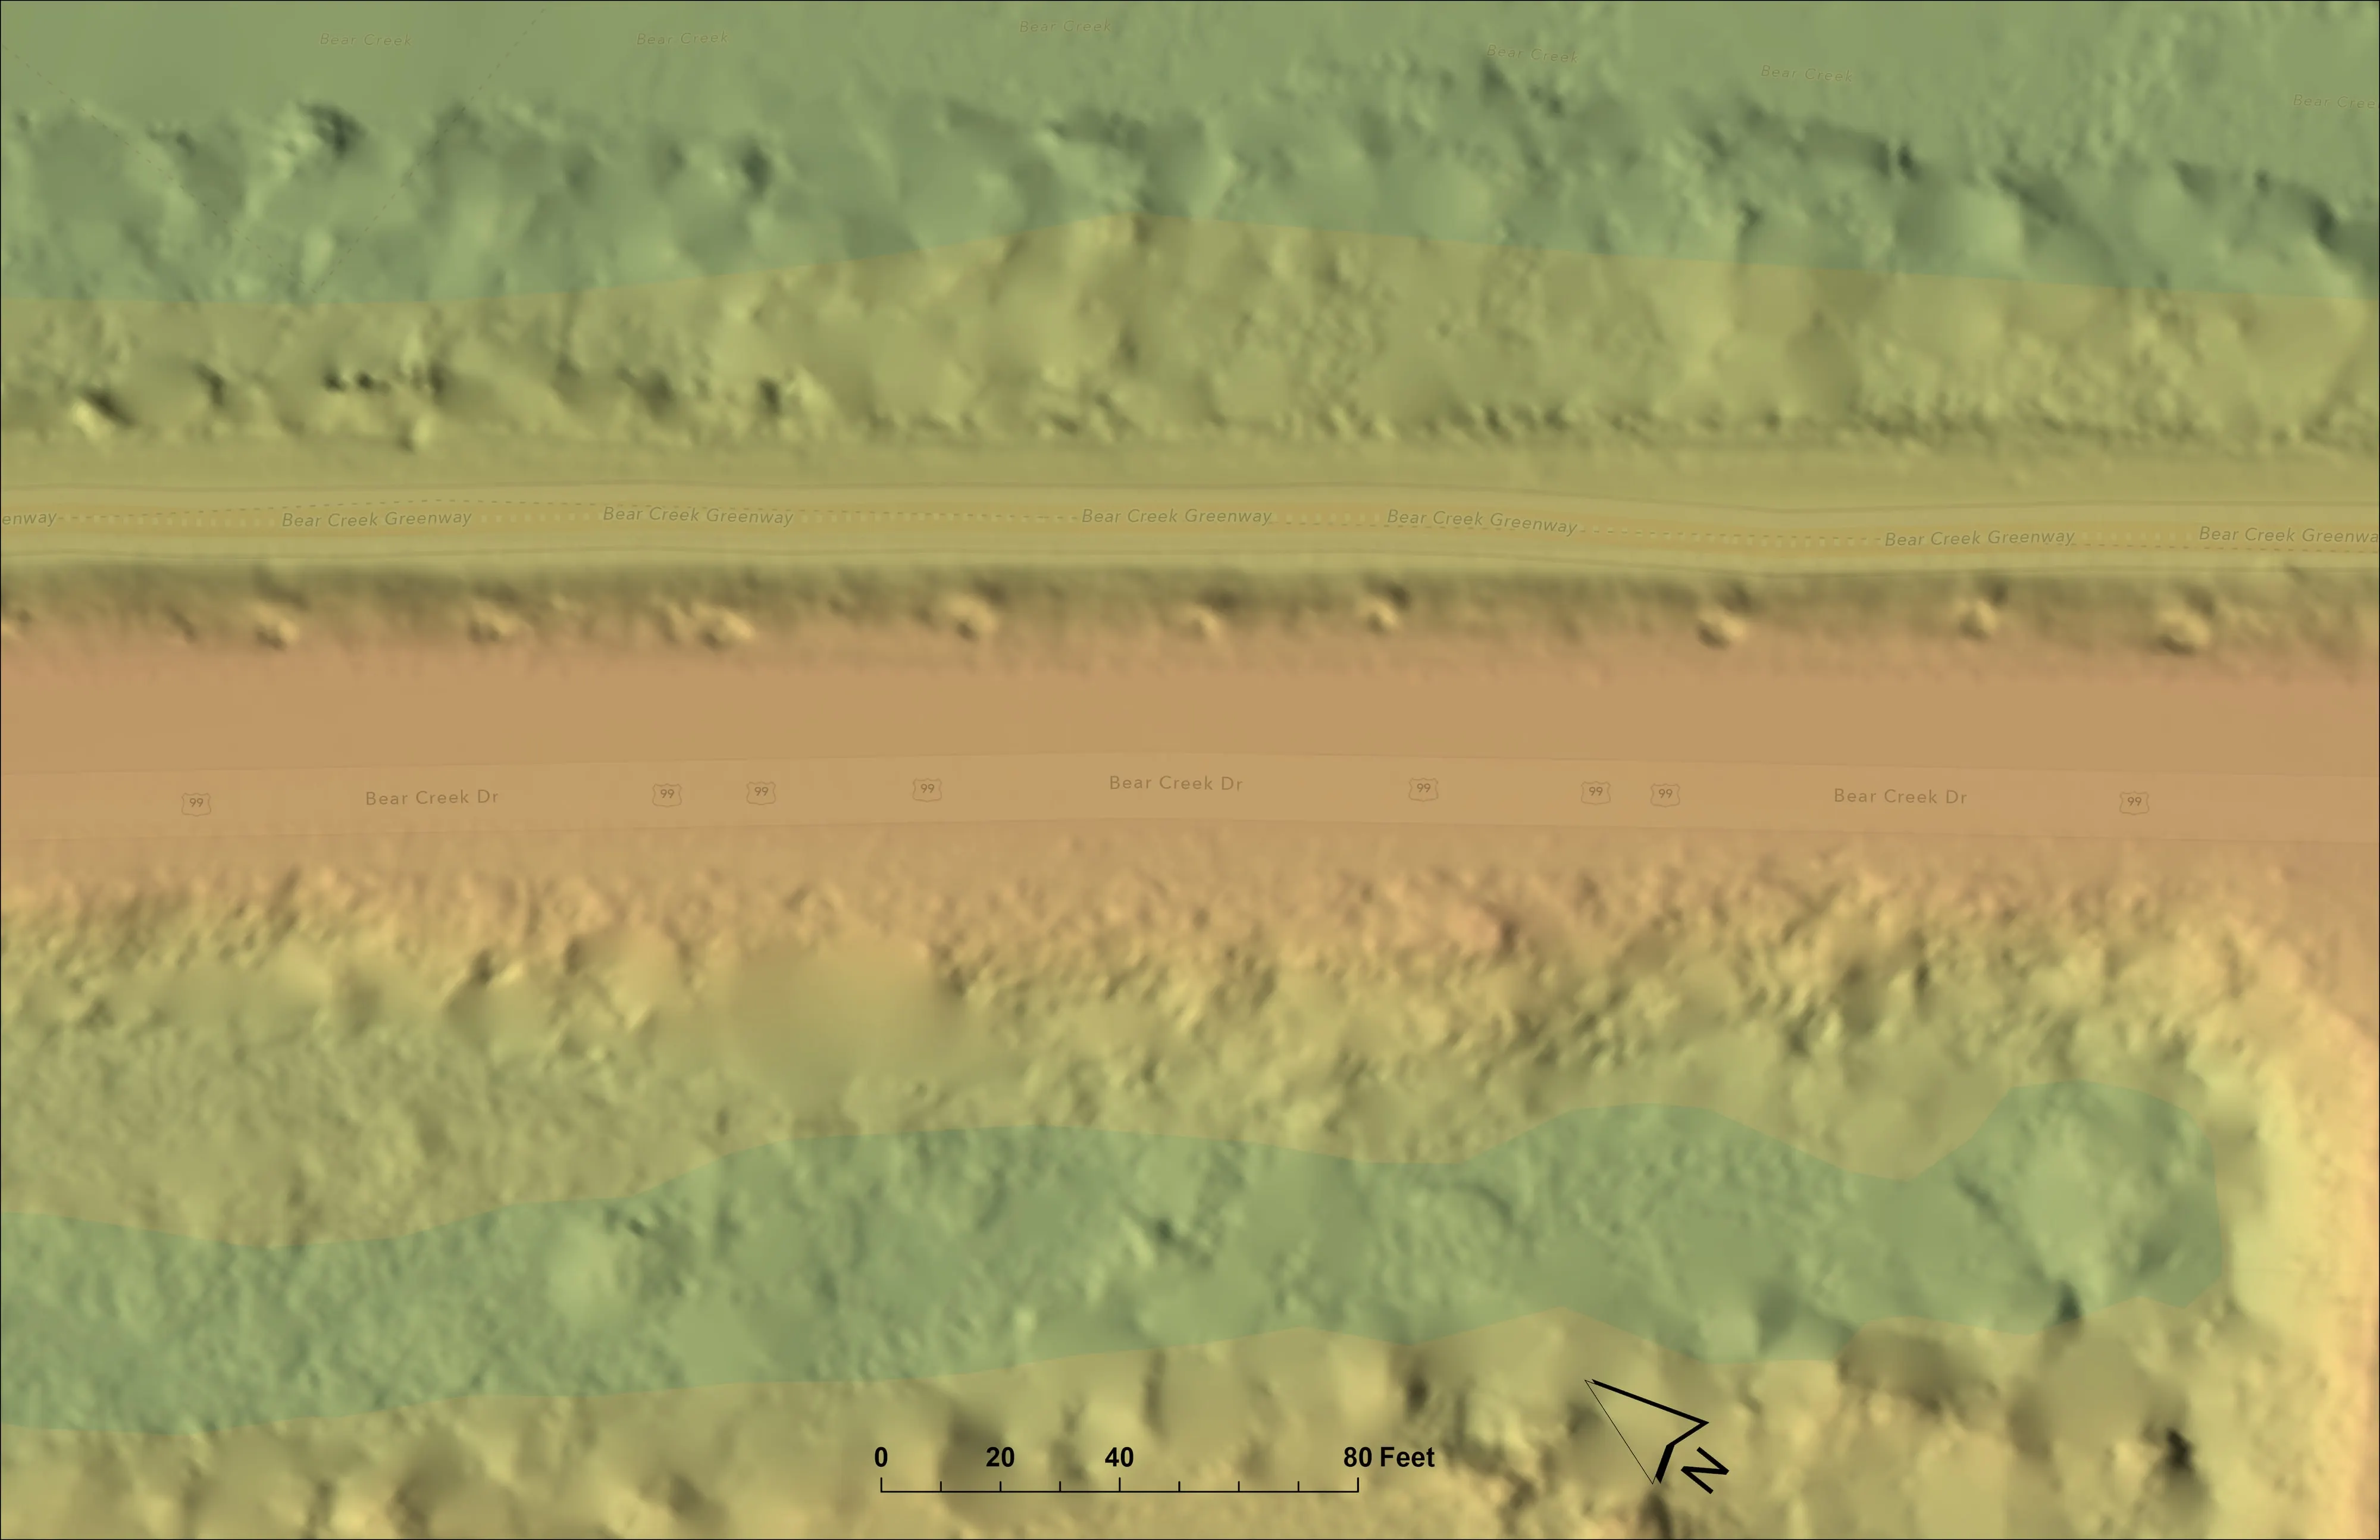
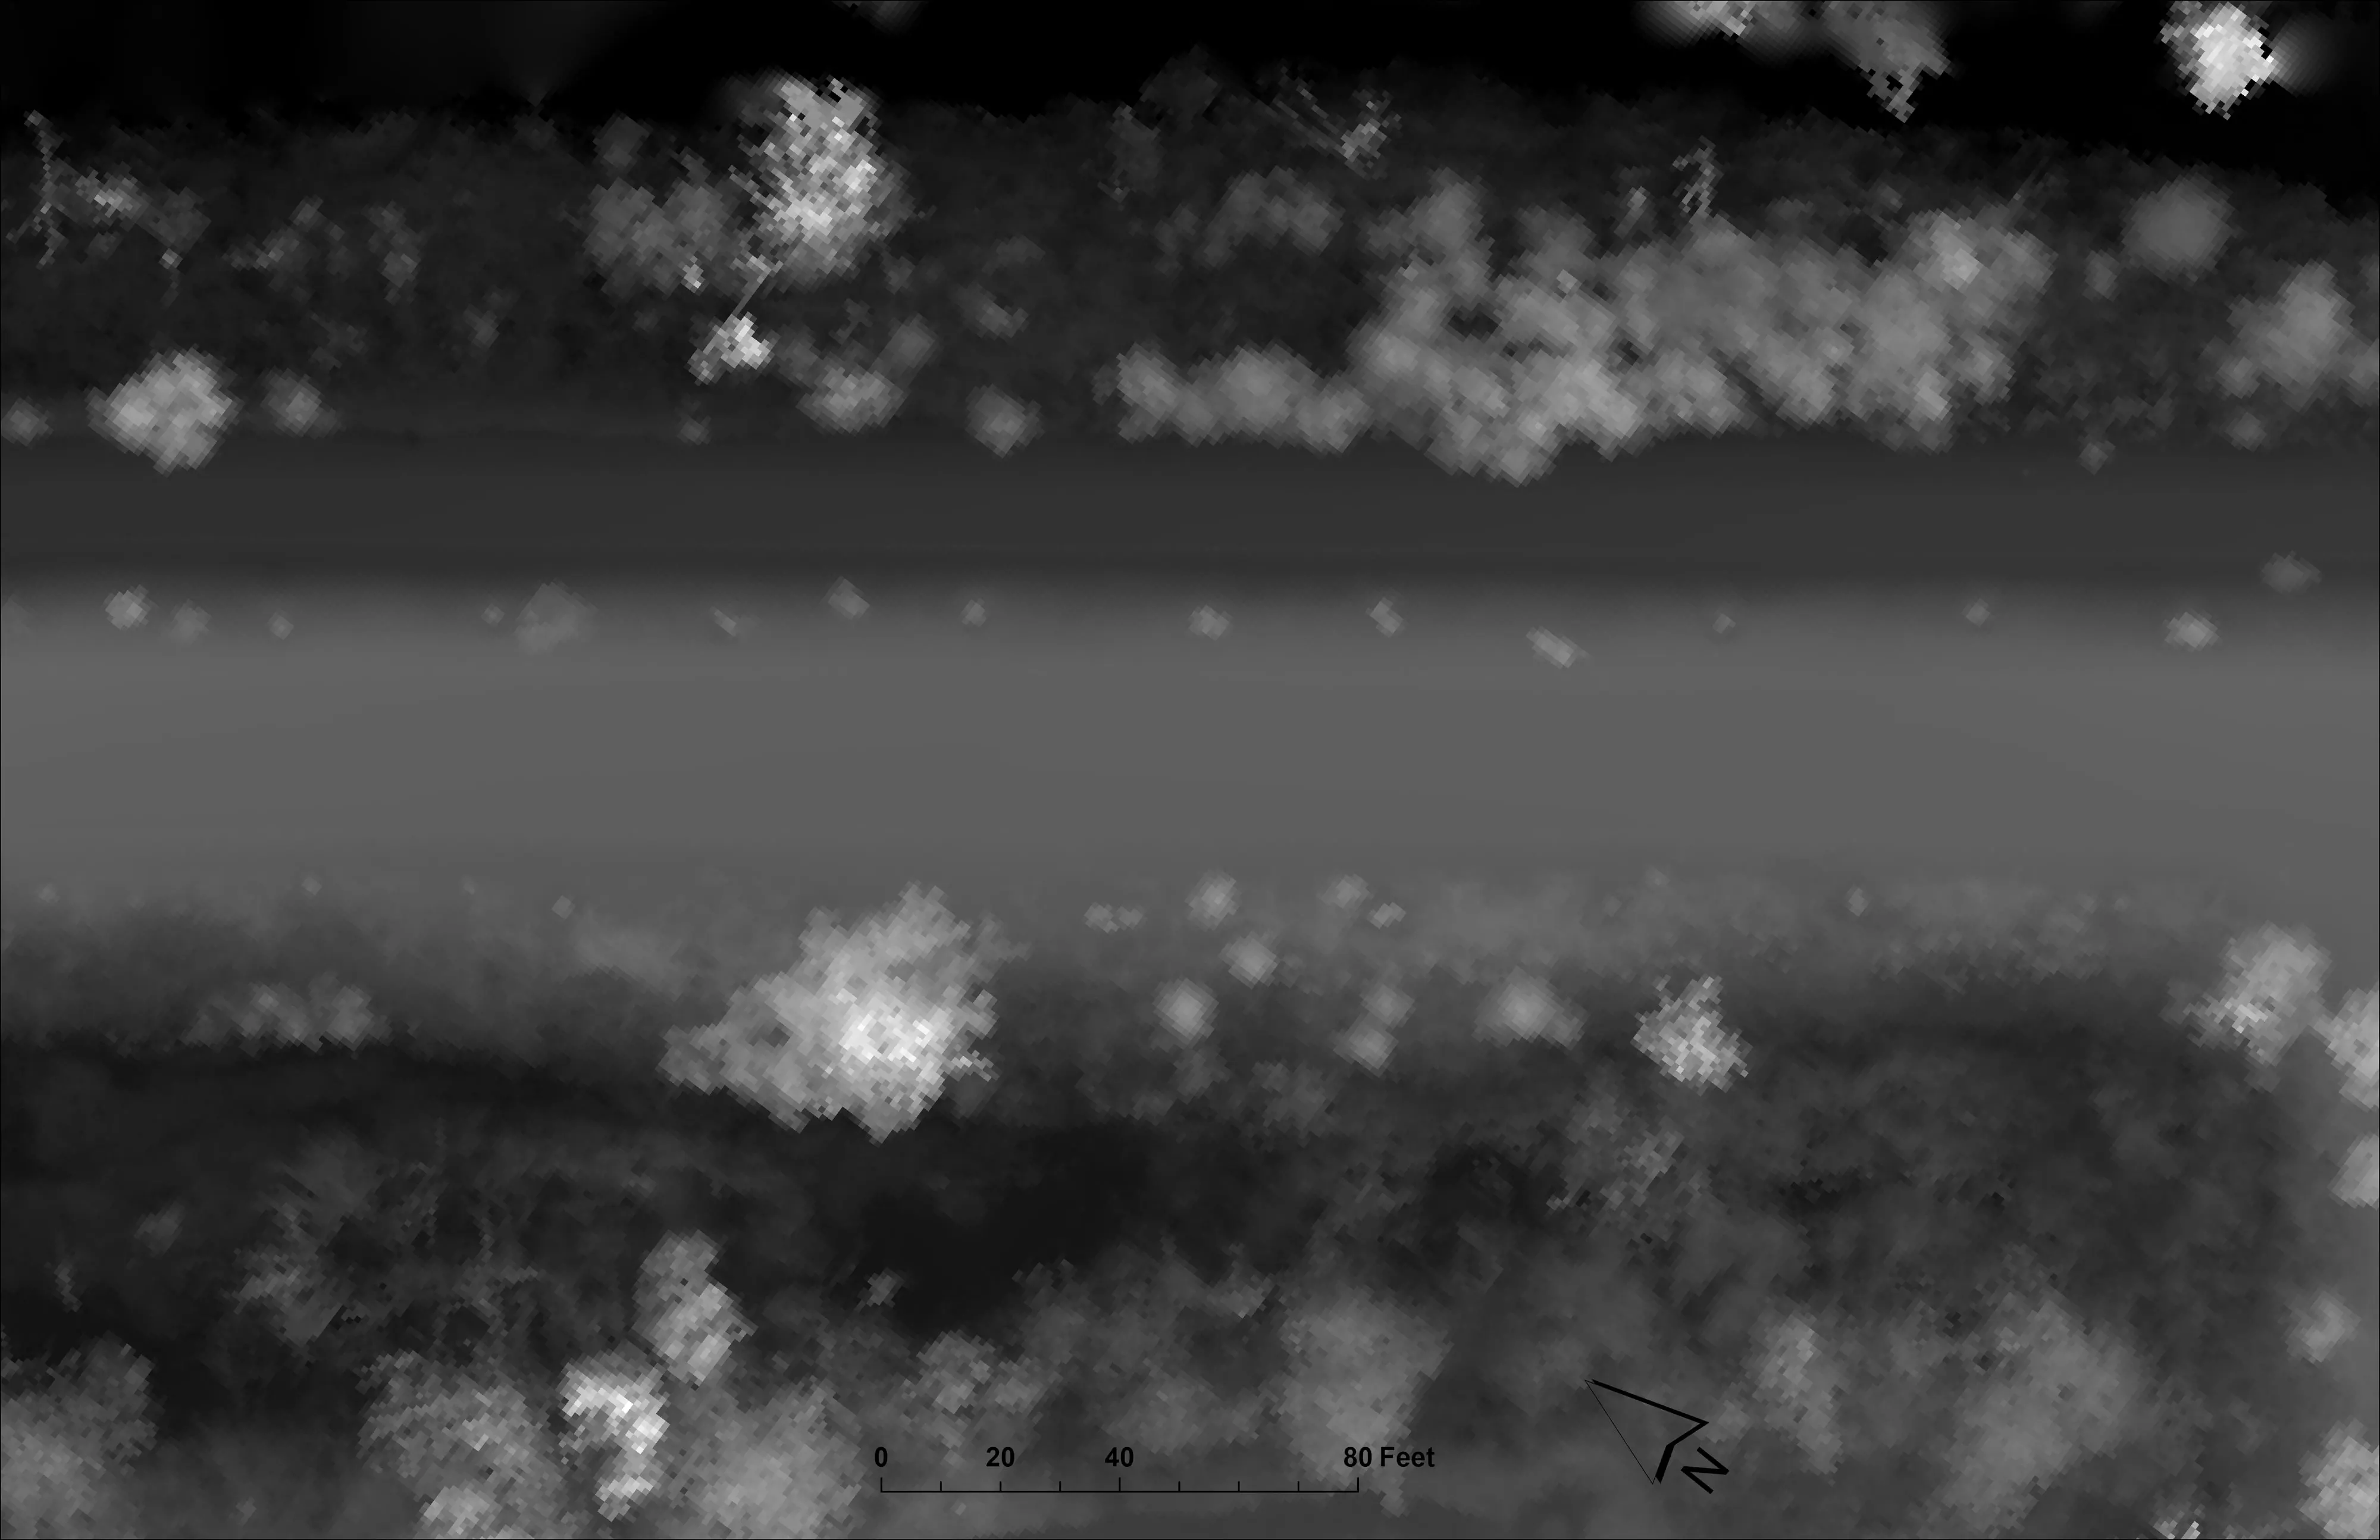
- Bare earth elevation model, surface model, and canopy height model
- A corridor tree canopy height model and surface model alongside the full ones
- Orthomosaic
- Tree points and tree polygons as shapefiles, each with a tree height and a canopy area
- 4 tile packages, 7 videos, and 30 renders
The 2020 Almeda fire burned through this stretch of the Bear Creek Greenway and Highway 99. The city planted 98 trees along it on April 12, 2025 and walked the planting on May 29 to record each one. We flew it on June 16, 65 days after planting, so year one has an orthomosaic, a bare earth model, a surface model, a canopy height model, and tree points and polygons with a height and a canopy area on each. The city’s record says what went in the ground. Ours says what stood there in June.
A canopy height model is the surface model minus the bare earth, so every cell is the height of what stands there. Fly the corridor again next June and subtract this one, and the arborist gets a year of growth for the whole planting in one raster, with the trees that stalled standing out as the cells that did not move. The tree points and polygons tell the same story one tree at a time, and they tell the arborist which trees to walk to first.